

HOT TOPICS LIST
- MACD
- Fibonacci
- RSI
- Gann
- ADXR
- Stochastics
- Volume
- Triangles
- Futures
- Cycles
- Volatility
- ZIGZAG
- MESA
- Retracement
- Aroon
INDICATORS LIST
LIST OF TOPICS
PRINT THIS ARTICLE
by Donald W. Pendergast, Jr.
Up by more than 1,600% since November 2008, shares of Cigna Corp. are now closing in fast on a major monthly cycle high.
Position: N/A
Donald W. Pendergast, Jr.
Freelance financial markets writer and online publisher of the Trendzetterz.com S&P 500 Weekly Forecast service.
PRINT THIS ARTICLE
CYCLES
Cigna Corp: Surging Into Unsustainable Territory?
05/28/15 04:43:58 PMby Donald W. Pendergast, Jr.
Up by more than 1,600% since November 2008, shares of Cigna Corp. are now closing in fast on a major monthly cycle high.
Position: N/A
| Few other large cap S&P 500 issues have trended as strongly as those of Cigna Corp. (CI) since its generational low of $8 per share (set in November 2008) was made. A 1,615% rally in a major insurance stock is a rare event indeed, and long-term shareholders must be thrilled. But they need to make sure that apathy doesn't set in at this late stage of the rally, causing them to lose significant amounts of unrealized capital gains. A major monthly cycle high is due sometime in the second half of 2015 for this stock, so here are the key technicals that traders need to be aware of now. |
|
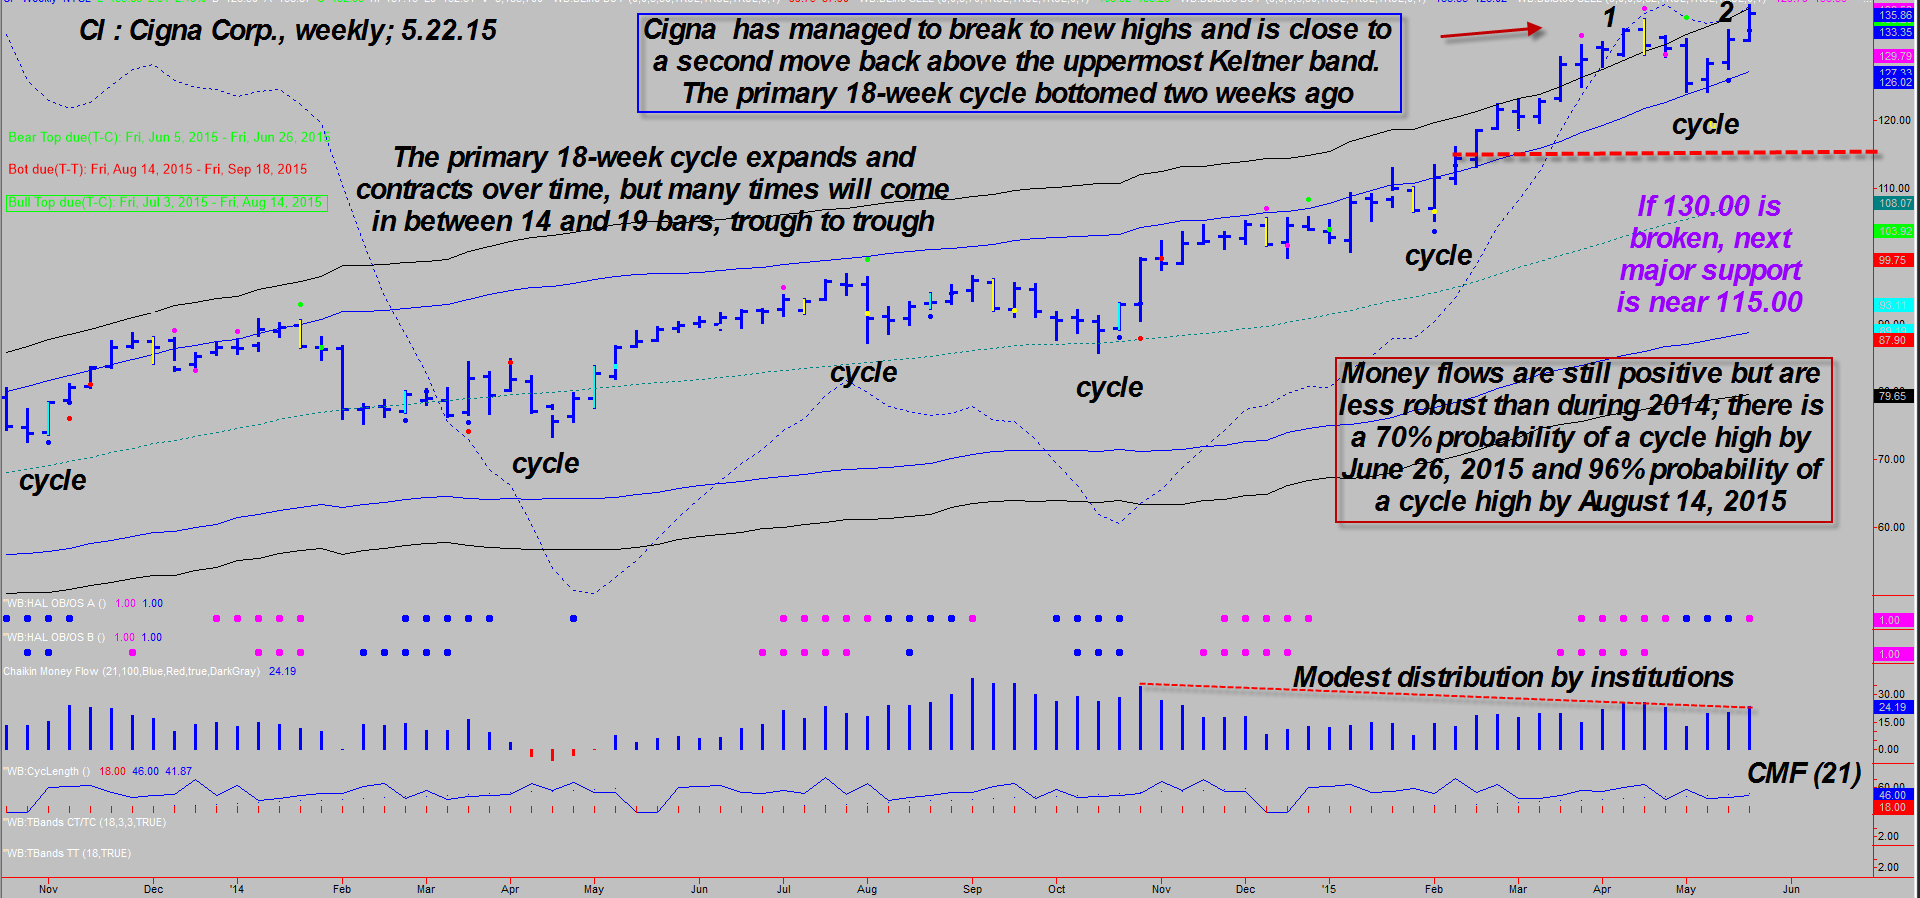
| Figure 1. Weekly Chart. Cigna Corp. (CI) has a nice, tradable 18-week cycle — most of the time. The cycle length does expand/contract however, meaning that traders need to use additional technical tools to better time the major turning points. |
| Graphic provided by: TradeStation. |
| Graphic provided by: ProfitTrader7 from www.walterbressert.com. |
| |
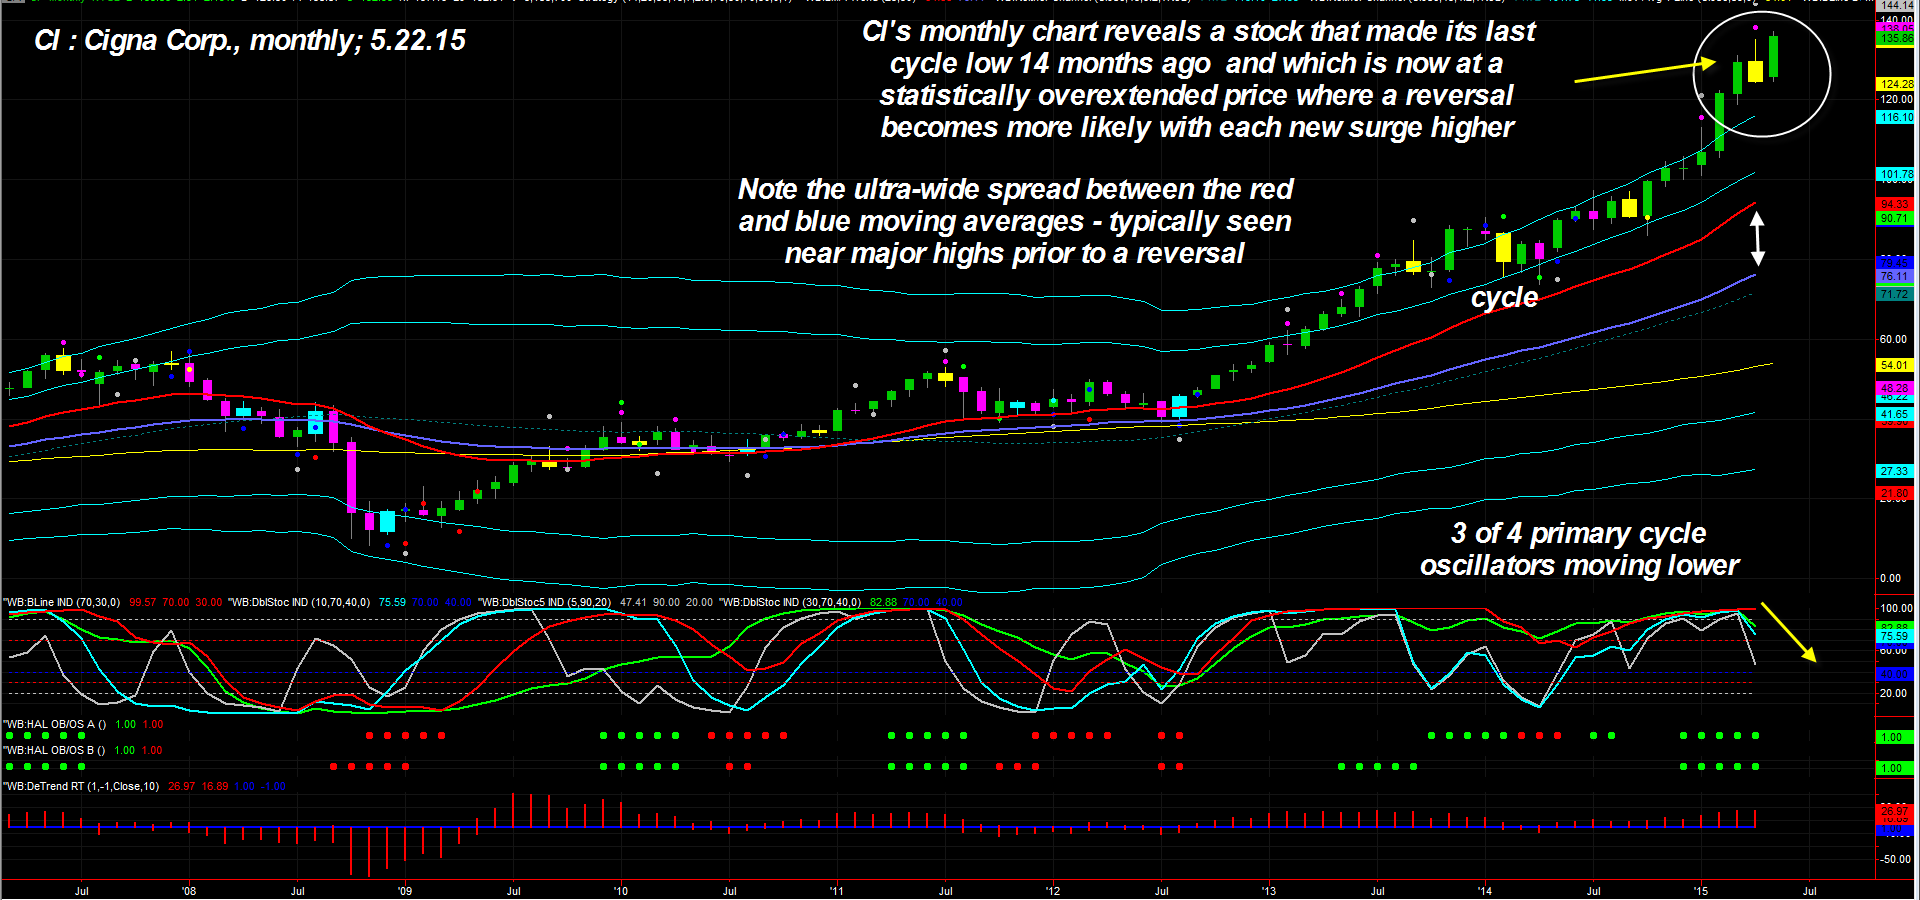
| CI's weekly chart in Figure 1 displays a nice, rhythmic cycle pattern, one that averages 18 weeks between bottoms (measured trough to trough); notice that at times the cycle extends for more than 20 weeks (bars) and at other times it contracts significantly. This kind of cyclic expansion/contraction occurs on all time frames and in all liquid financial instruments, so it's just part of the game of anticipating and trading cycle turns in the markets. The most recent cycle low occurred two weeks ago and the stock is rallying strong yet again, even making another attempt at breaking above the uppermost Keltner band (point 2), something it did only nine weeks ago (point 1). Normally, a late stage rally like this is suspect, given the obvious distribution evident (see the Chaikin money flow histogram at the bottom of chart), but what makes this surge higher unique is that it occurs after only a minor weekly chart pullback into the cycle low and that it remained fairly close to the upper band as it made the cycle low. This is telling cycle analysts that it's the monthly chart cycles that are in dominant control of CI at the moment, and if you look at the monthly chart (Figure 2) you find that the stock is on a rampage there too, stretching far above its upper Keltner band. Cigna's monthly cycle averages 20 weeks (trough to trough basis) in length and the current cycle is now 14 months old. Distribution is even more pronounced on this time frame and cycles analysis suggests that CI has a 70% probability of topping out within the next two to three months, followed by a significant trend reversal. The weekly cycles forecast is calling for a cycle high to be made within the next five weeks (70% probability) or 11 weeks (98% probability). Putting both forecasts together, it's not hard to understand that a major high is coming for CI, and most likely it will be during the summer of 2015. Given that three of the four primary monthly cycle oscillators for CI have already turned lower, perhaps the stock is already providing valuable clues about what to expect over the next few months. |
|
| Figure 2. Monthly Chart. Cigna's monthly cycle averages 20 bars in length (trough to trough basis) and is now in month 14 of its current bullish cycle. The stock is far above its upper Keltner band and the green 'overbought' dots are warning that a cycle high is due sooner rather than later. |
| Graphic provided by: TradeStation. |
| Graphic provided by: ProfitTrader7 from www.walterbressert.com. |
| |
| Once a correction does gain traction, the stock will have minor support near 130.00 (previous high volume zone) and once that gives way the next support (demand) zone lies between 110.00 and 115.00. Depending on how far CI corrects, we could be looking at a 12-18% revaluation in the share price sometime in the second half of 2015. Put buyers should have little trouble making money if or when 130.00 gives way on big volume; be sure to buy at least three to four months of time value and use in-the-money puts if you decide to go this route. Trade wisely until we meet here again. |
Freelance financial markets writer and online publisher of the Trendzetterz.com S&P 500 Weekly Forecast service.
| Title: | Market consultant and writer |
| Company: | Trendzetterz |
| Address: | 81 Hickory Hollow Drive |
| Crossville, TN 38555 | |
| Phone # for sales: | 904-303-4814 |
| Website: | trendzetterz.com |
| E-mail address: | support@trendzetterz.com |
Traders' Resource Links | |
| Trendzetterz has not added any product or service information to TRADERS' RESOURCE. | |
Click here for more information about our publications!
PRINT THIS ARTICLE

Request Information From Our Sponsors
- StockCharts.com, Inc.
- Candle Patterns
- Candlestick Charting Explained
- Intermarket Technical Analysis
- John Murphy on Chart Analysis
- John Murphy's Chart Pattern Recognition
- John Murphy's Market Message
- MurphyExplainsMarketAnalysis-Intermarket Analysis
- MurphyExplainsMarketAnalysis-Visual Analysis
- StockCharts.com
- Technical Analysis of the Financial Markets
- The Visual Investor
- VectorVest, Inc.
- Executive Premier Workshop
- One-Day Options Course
- OptionsPro
- Retirement Income Workshop
- Sure-Fire Trading Systems (VectorVest, Inc.)
- Trading as a Business Workshop
- VectorVest 7 EOD
- VectorVest 7 RealTime/IntraDay
- VectorVest AutoTester
- VectorVest Educational Services
- VectorVest OnLine
- VectorVest Options Analyzer
- VectorVest ProGraphics v6.0
- VectorVest ProTrader 7
- VectorVest RealTime Derby Tool
- VectorVest Simulator
- VectorVest Variator
- VectorVest Watchdog