HOT TOPICS LIST
- MACD
- Fibonacci
- RSI
- Gann
- ADXR
- Stochastics
- Volume
- Triangles
- Futures
- Cycles
- Volatility
- ZIGZAG
- MESA
- Retracement
- Aroon
INDICATORS LIST
LIST OF TOPICS
PRINT THIS ARTICLE
by Koos van der Merwe
Hewlett Packard is splitting into two companies, HP, Inc. and Hewlett-Packard Enterprises.
Position: Buy
Koos van der Merwe
Has been a technical analyst since 1969, and has worked as a futures and options trader with First Financial Futures in Johannesburg, South Africa.
PRINT THIS ARTICLE
ELLIOTT WAVE
A Look At Hewlett Packard
05/27/15 01:52:35 PMby Koos van der Merwe
Hewlett Packard is splitting into two companies, HP, Inc. and Hewlett-Packard Enterprises.
Position: Buy
| Meg Whitman, the CEO of Hewlett Packard has spent six years attempting to turn around the ailing Hewlett Packard, Inc. (HPQ). She has now decided to split the company in two, hoping to create two nimble outfits that should respond to the shifting technology marketplace far better. HP, Inc. will take the personal computing and printing operation with Dion Weisler as CEO. Meg Whitman will remain as Chairman. Whitman will be in charge of Hewlett-Packard Enterprises. Its ticker will be HPE. How has the market viewed these changes? |

|
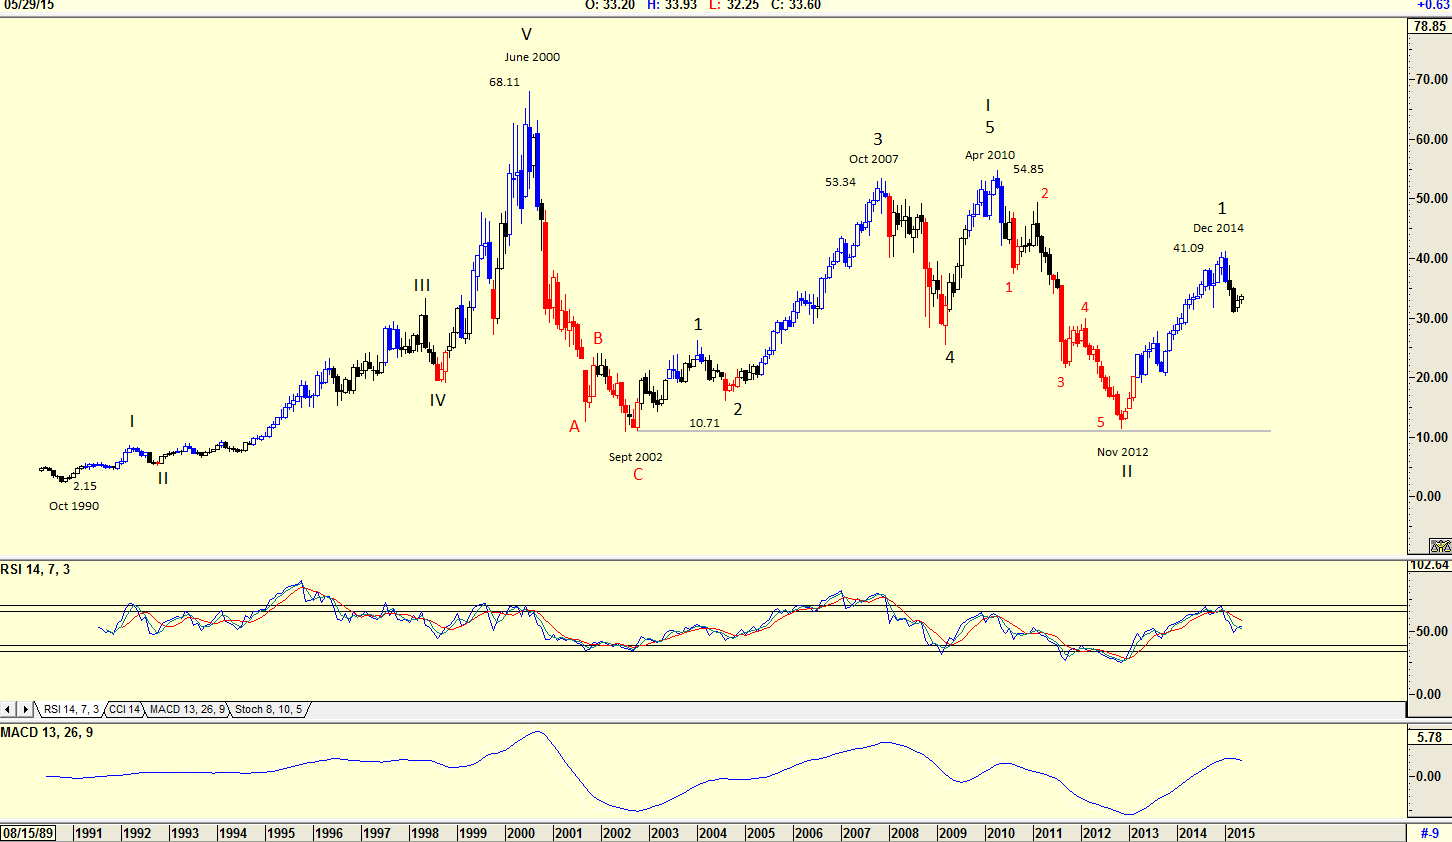
| Figure 1. Monthly Chart Of Hewlett-Packard (HPQ). The stock price rose from a low of $2.15 in October 1990 to a high of $68 by June 2000. The price then collapsed to a low of $10.71 by September 2002 as the technology bubble burst. |
| Graphic provided by: AdvancedGET. |
| |
| The chart in Figure 1 is a monthly chart of HPQ showing how the stock price rose from a low of $2.15 in October 1990 to a high of $68.11 by June 2000. The stock price then collapsed to a low of $10.71 by September 2002 as the technology bubble burst. The stock price then started rising reaching a high of $54.85 by April 2010. Note the Elliott wave count with wave 2 simple correction. This means that wave 4 would be a complicated correction which is what occurred. The Elliott wave count then completed a major WAVE I, with WAVE II being a 100% correction of WAVE I, forming a double bottom at $10.71 by November 2012. The price has since risen to $41.09 by December 2014 in a Wave 1 and is now tracing a Wave 2. The relative strength index (RSI) and the MACD indicator are suggesting further weakness. |

|
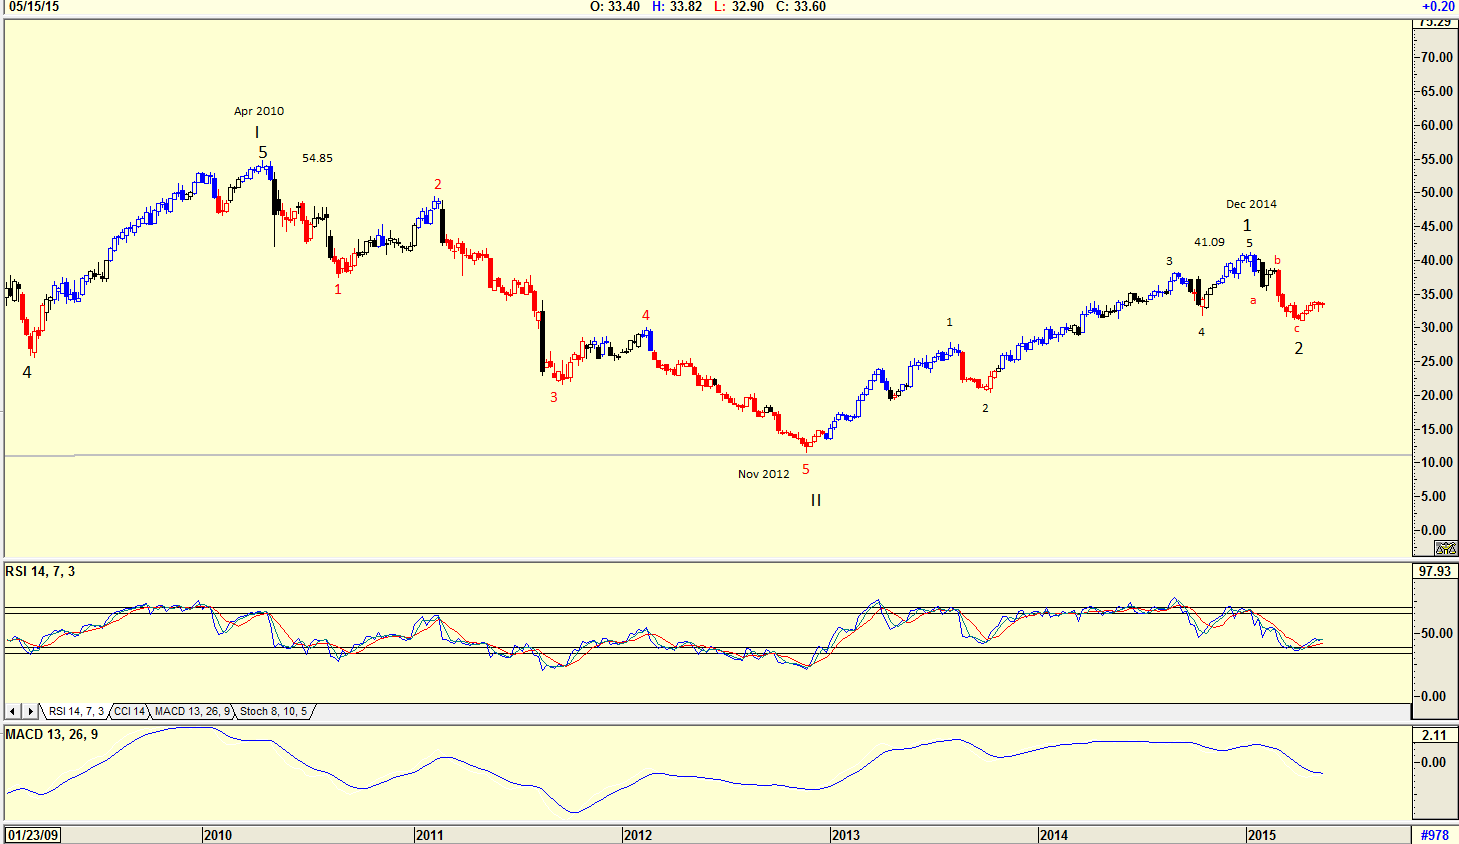
| Figure 2. Weekly Chart Of HPQ. The relative strength index (RSI) and MACD are suggesting a buy. The Elliott wave count is suggesting that the Wave 2 correction is complete and that the stock price should now start rising in a Wave 3 of WAVE III. |
| Graphic provided by: AdvancedGET. |
| |
| The weekly chart in Figure 2, on the other hand has an RSI and MACD indicator which are suggesting a buy. The Elliott wave count is suggesting that the Wave 2 correction is complete and that the stock price should now start rising in a Wave 3 of WAVE III. |

|
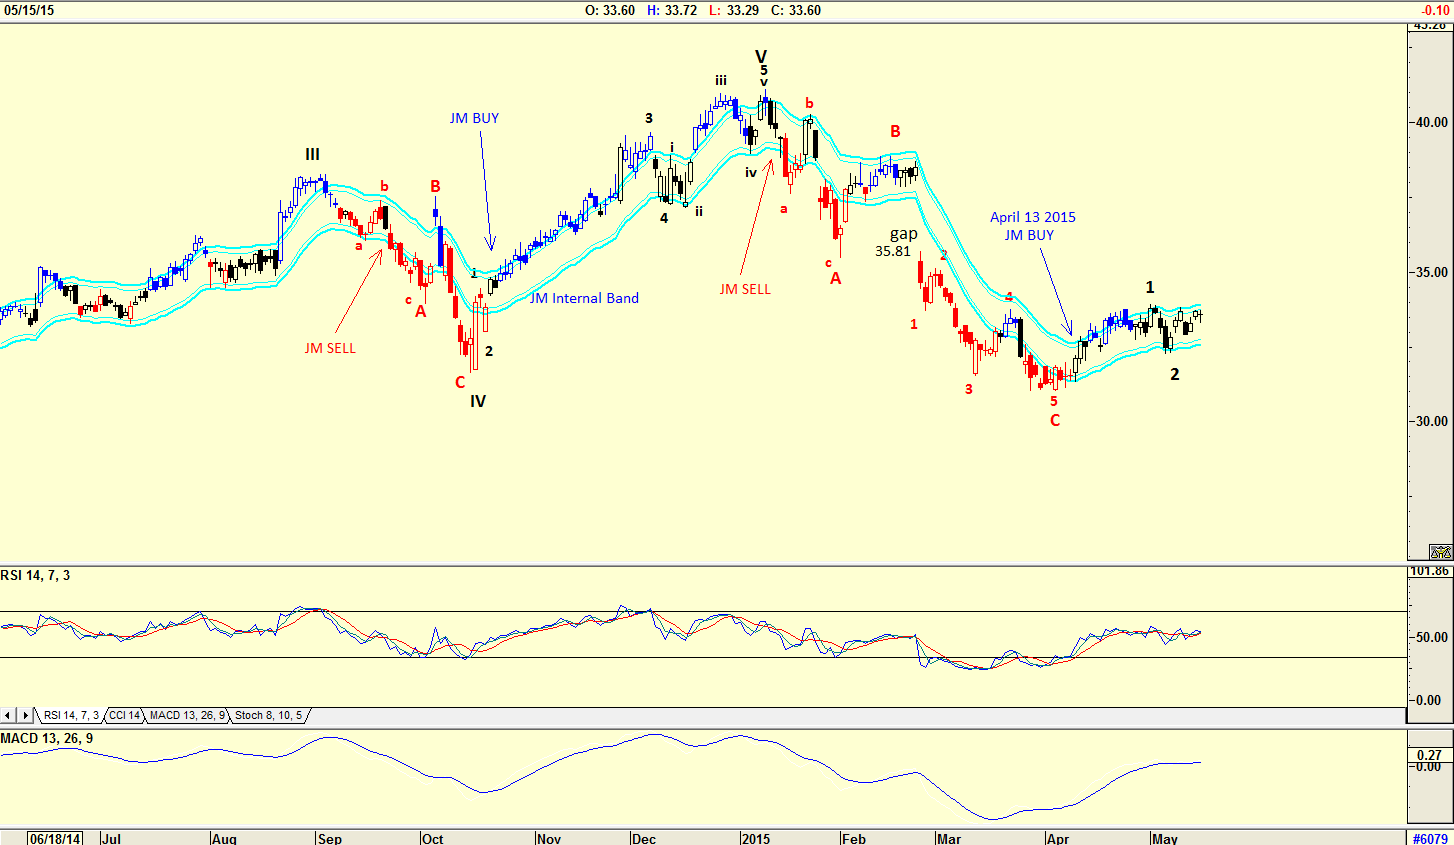
| Figure 3. Daily Chart With Elliott Wave Count and JM Internal Band. The RSI, MACD, Elliott wave count, and JM internal band all give buy signals here. |
| Graphic provided by: AdvancedGET. |
| |
| The daily chart in Figure 3 has the RSI and MACD indicators suggesting strength, with the Elliott wave count suggesting that the share price should rise to fill the gap at $35.81 in a Wave 3. Note the JM internal buy given on April 13, 2015. A JM internal band is a 15-period moving average offset by 2% positive and 2% negative. A move above the upper band suggests a buy signal, and a move below the lower band a sell signal. Although the share price is presently testing the lower JM Band, a sell signal has not been triggered. The gap shown on the daily chart is suggesting that the share price should rise in a Wave 3 to "fill the gap" at $35.81 or higher before correcting in a Wave 4. The weekly and daily charts of HP are suggesting a buy but the monthly chart is looking for further weakness. This suggests that one should wait for a JM internal band buy signal with stops kept close. The gap shown on the daily chart is suggesting that the share price should rise in a Wave 3 to fill the gap at $35.81 or higher before correcting in a Wave 4. |
Has been a technical analyst since 1969, and has worked as a futures and options trader with First Financial Futures in Johannesburg, South Africa.
| Address: | 3256 West 24th Ave |
| Vancouver, BC | |
| Phone # for sales: | 6042634214 |
| E-mail address: | petroosp@gmail.com |
Click here for more information about our publications!
PRINT THIS ARTICLE

|

Request Information From Our Sponsors
- StockCharts.com, Inc.
- Candle Patterns
- Candlestick Charting Explained
- Intermarket Technical Analysis
- John Murphy on Chart Analysis
- John Murphy's Chart Pattern Recognition
- John Murphy's Market Message
- MurphyExplainsMarketAnalysis-Intermarket Analysis
- MurphyExplainsMarketAnalysis-Visual Analysis
- StockCharts.com
- Technical Analysis of the Financial Markets
- The Visual Investor
- VectorVest, Inc.
- Executive Premier Workshop
- One-Day Options Course
- OptionsPro
- Retirement Income Workshop
- Sure-Fire Trading Systems (VectorVest, Inc.)
- Trading as a Business Workshop
- VectorVest 7 EOD
- VectorVest 7 RealTime/IntraDay
- VectorVest AutoTester
- VectorVest Educational Services
- VectorVest OnLine
- VectorVest Options Analyzer
- VectorVest ProGraphics v6.0
- VectorVest ProTrader 7
- VectorVest RealTime Derby Tool
- VectorVest Simulator
- VectorVest Variator
- VectorVest Watchdog
