HOT TOPICS LIST
- MACD
- Fibonacci
- RSI
- Gann
- ADXR
- Stochastics
- Volume
- Triangles
- Futures
- Cycles
- Volatility
- ZIGZAG
- MESA
- Retracement
- Aroon
INDICATORS LIST
LIST OF TOPICS
PRINT THIS ARTICLE
by Donald W. Pendergast, Jr.
Up by nearly 800% in the past year, shares of BlueBird Bio, Inc. have issued a major weekly sell signal.
Position: N/A
Donald W. Pendergast, Jr.
Freelance financial markets writer and online publisher of the Trendzetterz.com S&P 500 Weekly Forecast service.
PRINT THIS ARTICLE
CYCLES
BLUE: Overextended On Weekly And Monthly Charts
05/20/15 12:18:08 PMby Donald W. Pendergast, Jr.
Up by nearly 800% in the past year, shares of BlueBird Bio, Inc. have issued a major weekly sell signal.
Position: N/A
| It's always exciting to see a newly issued stock blast higher in the months following its IPO; Bluebird Bio, Inc.(BLUE) has surely made early buyers (and holders) of its shares extremely happy, especially since its near-parabolic ascent since December 2014. Long-term, this stock appears to have a promising future indeed, but skilled technicians are already seeing the initial warning signs of a proportional correction in the works. Here's a closer look now. |

|
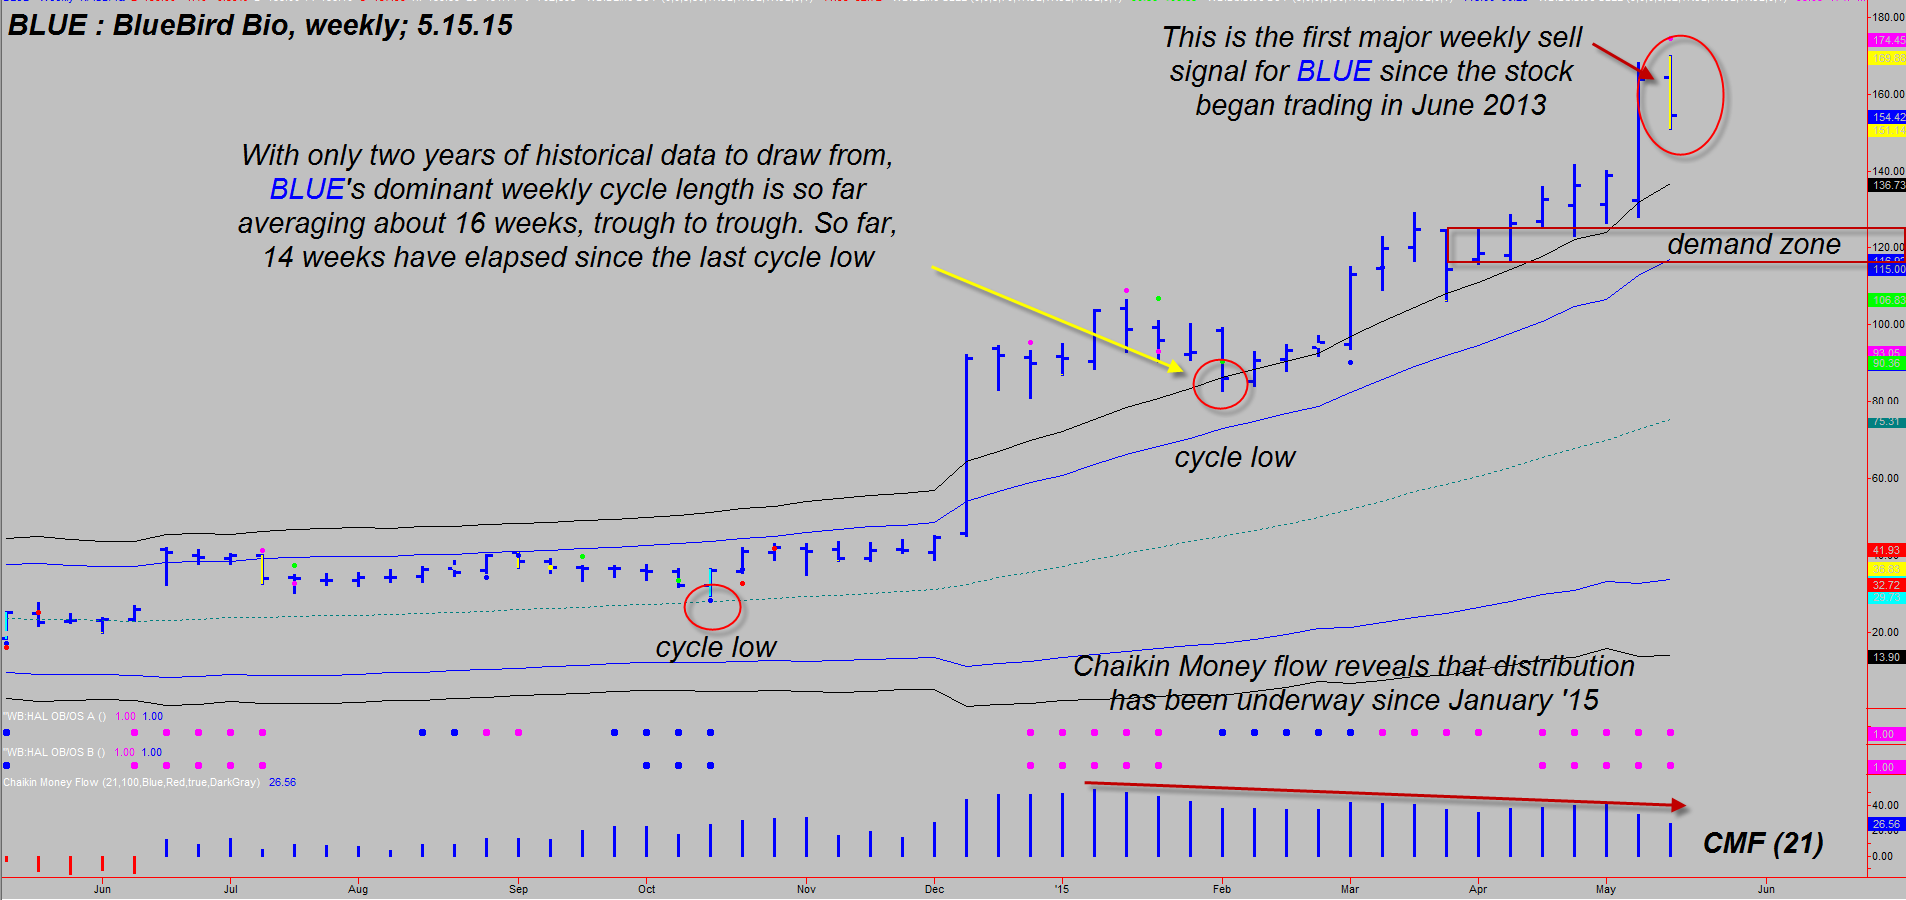
| Figure 1. Weekly Chart Of BlueBird Bio Inc. (BLUE). Here you see that the stock has generated the first major sell signal in its entire trading history — at statistically unsustainable price levels. |
| Graphic provided by: TradeStation. |
| Graphic provided by: ProfitTrader7 from www.walterbressert.com. |
| |
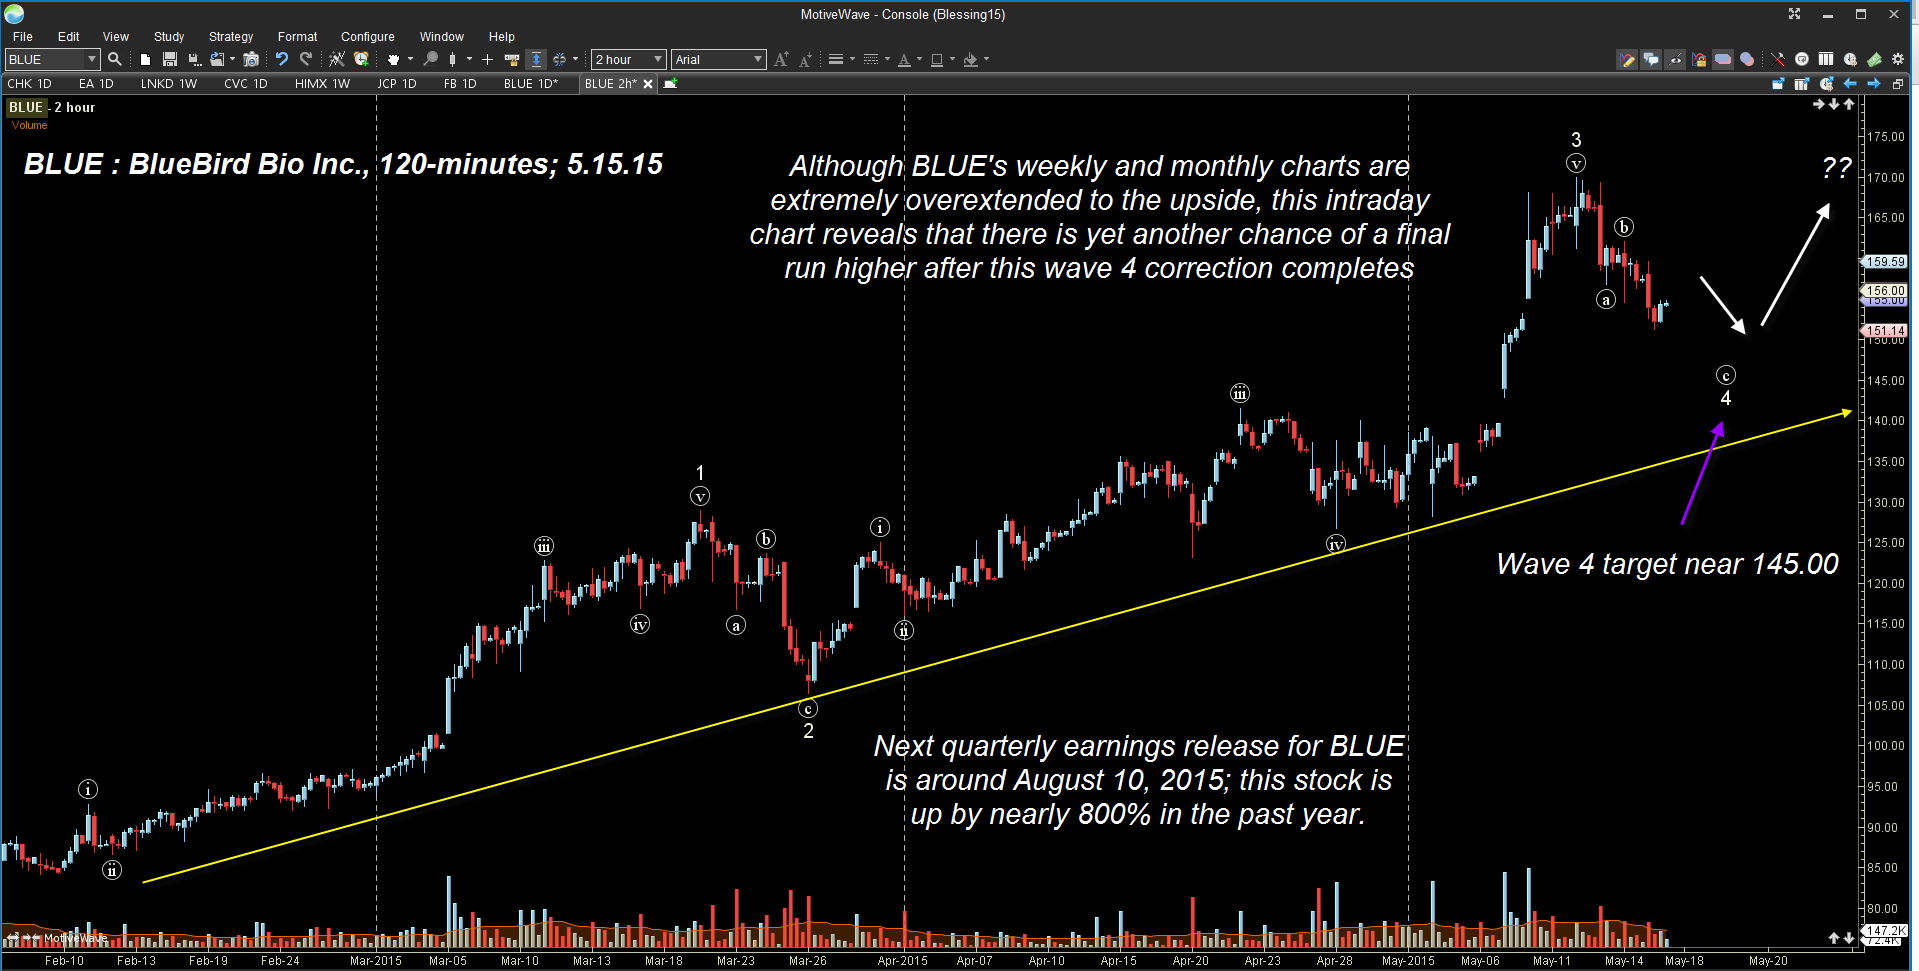
| When a stock trades above both pairs of upper Keltner bands for more than seven to 10 price bars, the odds are extremely high that a correction of some degree is imminent; when this occurs on a stock's daily, weekly, and monthly charts simultaneously, you have a recipe for a short-seller's paradise — all else being equal. And, of course, that's just the case now on BLUE's charts, too. So here are the main technicals warning of a healthy correction soon (see Figure 1): 1. The 21-week Chaikin money flow histogram (CMF)(21) reveals that the "smart money" (big institutional investors) were using the latest upsurge in BLUE to lighten up on their holdings. Since they account for 80% of all stock market trading volume, it pays to be on the same side of a given market as they are. 2. BLUE has issued a significant weekly cycle oscillator sell signal, the first one since the stock began trading in June 2013. 3. Additional overbought indicators have also confirmed that BLUE is statistically overstretched. 4. Looking at the posts on one of the popular social networking stock websites earlier in the week showed little bearish sentiment in BLUE, something always seen as a major pullback/correction is ready to manifest. 5. BLUE's weekly price cycle averages 16 weeks (trough to trough) and is now in week 14; this could be the start of a major bear-to-bull cycle phase shift as summer 2015 approaches. 6. Volume analysis reveals that the next strong demand zone for BLUE is down near 120.00, which is about 20% below today's overinflated valuations. All in all, this is a recipe for a proportional correction of a stock in a secular bullish trend. However, there is something else to consider here, and this is where dropping down to an intraday time frame chart can be extremely helpful to market timers. The 120-minute chart for BLUE in Figure 2 shows a stock still heading lower in a wave 4 correction that has a nominal price target near 145.00; this means there is also a strong probability that some sort of wave 5 advance will occur, one that may form a final double top pattern on this time frame before the whole shebang starts heading lower in a hurry. |

|
| Figure 2. 120-minute Chart Of BLUE. A valid Elliott corrective wave 4 is in process; once complete, expect at least a minor wave 5 bounce before bigger declines to come in summer 2015. |
| Graphic provided by: MotiveWave Trading Software at www.motivewave.com. |
| |
| Existing longs should already be flat BLUE unless they believe the stock will quickly rebound from any impending correction. Speculative bears may consider buying in-the-money put options once the wave 5 rally gets well underway. I suspect that rally will fail without much warning and that BLUE will fall fast toward 120.00 to 125.00 by late June/early July 2015. Keep your account risks modest no matter how you trade BLUE and be sure to trade wisely until we meet here again. |
Freelance financial markets writer and online publisher of the Trendzetterz.com S&P 500 Weekly Forecast service.
| Title: | Market consultant and writer |
| Company: | Trendzetterz |
| Address: | 81 Hickory Hollow Drive |
| Crossville, TN 38555 | |
| Phone # for sales: | 904-303-4814 |
| Website: | trendzetterz.com |
| E-mail address: | support@trendzetterz.com |
Traders' Resource Links | |
| Trendzetterz has not added any product or service information to TRADERS' RESOURCE. | |
Click here for more information about our publications!
PRINT THIS ARTICLE

|

Request Information From Our Sponsors
- StockCharts.com, Inc.
- Candle Patterns
- Candlestick Charting Explained
- Intermarket Technical Analysis
- John Murphy on Chart Analysis
- John Murphy's Chart Pattern Recognition
- John Murphy's Market Message
- MurphyExplainsMarketAnalysis-Intermarket Analysis
- MurphyExplainsMarketAnalysis-Visual Analysis
- StockCharts.com
- Technical Analysis of the Financial Markets
- The Visual Investor
- VectorVest, Inc.
- Executive Premier Workshop
- One-Day Options Course
- OptionsPro
- Retirement Income Workshop
- Sure-Fire Trading Systems (VectorVest, Inc.)
- Trading as a Business Workshop
- VectorVest 7 EOD
- VectorVest 7 RealTime/IntraDay
- VectorVest AutoTester
- VectorVest Educational Services
- VectorVest OnLine
- VectorVest Options Analyzer
- VectorVest ProGraphics v6.0
- VectorVest ProTrader 7
- VectorVest RealTime Derby Tool
- VectorVest Simulator
- VectorVest Variator
- VectorVest Watchdog
