HOT TOPICS LIST
- MACD
- Fibonacci
- RSI
- Gann
- ADXR
- Stochastics
- Volume
- Triangles
- Futures
- Cycles
- Volatility
- ZIGZAG
- MESA
- Retracement
- Aroon
INDICATORS LIST
LIST OF TOPICS
PRINT THIS ARTICLE
by Gary Grosschadl
Again the USD shows a turn in market direction. Clues as to how far the Dow and Nasdaq run may be revealed in this chart.
Position: N/A
Gary Grosschadl
Independent Canadian equities trader and technical analyst based in Peterborough
Ontario, Canada.
PRINT THIS ARTICLE
CHART ANALYSIS
US Dollar Leads The Way Higher
11/15/02 01:01:09 PMby Gary Grosschadl
Again the USD shows a turn in market direction. Clues as to how far the Dow and Nasdaq run may be revealed in this chart.
Position: N/A
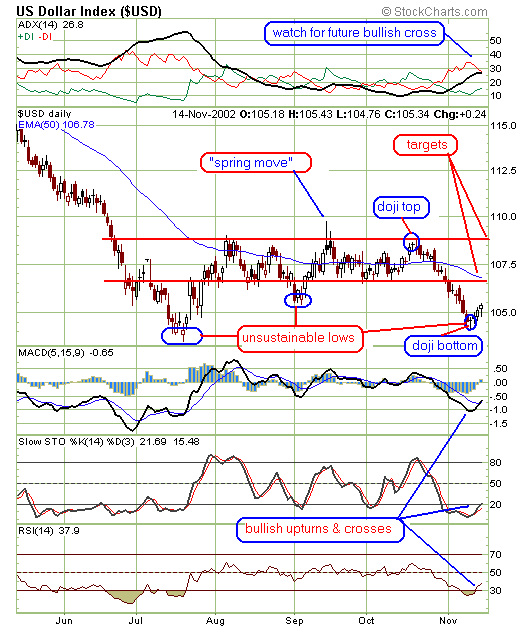
| The USD launched itself off its bottom with a doji type candlestick pattern, and ironically a similar doji warned of the imminent downturn from its previous high. Doji candles at tops and bottoms are often good reversal signals. |
| The chart shows a sideways channel that, when violated to the downside, is an unsustainable deviation. This results in a move to the top of the channel. In the middle area, a "spring move" occurred when the downside violation resulted in an equal and opposite move to the topside violation. |

|
| Graphic provided by: stockcharts.com. |
| |
| I am suggesting two upside target possibilities to watch for. Either a stall/consolidation at bottom of channel or a much bigger and bolder move to challenge the top of channel. The displayed indicators below the chart show a bullish turn from oversold territory. These same indicators should be monitored for a similar turn from overbought levels. The directional movement indicator ADX/DI above the chart should be monitored for signs of a bullish DI cross. Watch for either a stall at the cross area or a strong move resulting in ADX moving between the DIs, with +DI over -DI. |
| A bullish move in USD fosters confidence in overall indices. Sometimes the USD will lead market direction by a small margin and other times it moves in sync and acts to verify a possible move. Either way it bears watching. |
Independent Canadian equities trader and technical analyst based in Peterborough
Ontario, Canada.
| Website: | www.whatsonsale.ca/financial.html |
| E-mail address: | gwg7@sympatico.ca |
Click here for more information about our publications!
Comments
Date: 11/19/02Rank: 5Comment:
Date: 11/19/02Rank: 5Comment:
Date: 11/30/02Rank: 2Comment:

Request Information From Our Sponsors
- StockCharts.com, Inc.
- Candle Patterns
- Candlestick Charting Explained
- Intermarket Technical Analysis
- John Murphy on Chart Analysis
- John Murphy's Chart Pattern Recognition
- John Murphy's Market Message
- MurphyExplainsMarketAnalysis-Intermarket Analysis
- MurphyExplainsMarketAnalysis-Visual Analysis
- StockCharts.com
- Technical Analysis of the Financial Markets
- The Visual Investor
- VectorVest, Inc.
- Executive Premier Workshop
- One-Day Options Course
- OptionsPro
- Retirement Income Workshop
- Sure-Fire Trading Systems (VectorVest, Inc.)
- Trading as a Business Workshop
- VectorVest 7 EOD
- VectorVest 7 RealTime/IntraDay
- VectorVest AutoTester
- VectorVest Educational Services
- VectorVest OnLine
- VectorVest Options Analyzer
- VectorVest ProGraphics v6.0
- VectorVest ProTrader 7
- VectorVest RealTime Derby Tool
- VectorVest Simulator
- VectorVest Variator
- VectorVest Watchdog
