HOT TOPICS LIST
- MACD
- Fibonacci
- RSI
- Gann
- ADXR
- Stochastics
- Volume
- Triangles
- Futures
- Cycles
- Volatility
- ZIGZAG
- MESA
- Retracement
- Aroon
INDICATORS LIST
LIST OF TOPICS
PRINT THIS ARTICLE
by Chaitali Mohile
Korn/Ferry International failed to break its historical resistance. Is it worth waiting for this expected bullish breakout?
Position: N/A
Chaitali Mohile
Active trader in the Indian stock markets since 2003 and a full-time writer. Trading is largely based upon technical analysis.
PRINT THIS ARTICLE
SUPPORT & RESISTANCE
Korn/Ferry International Struggling Near Resistance
05/18/15 04:09:39 PMby Chaitali Mohile
Korn/Ferry International failed to break its historical resistance. Is it worth waiting for this expected bullish breakout?
Position: N/A
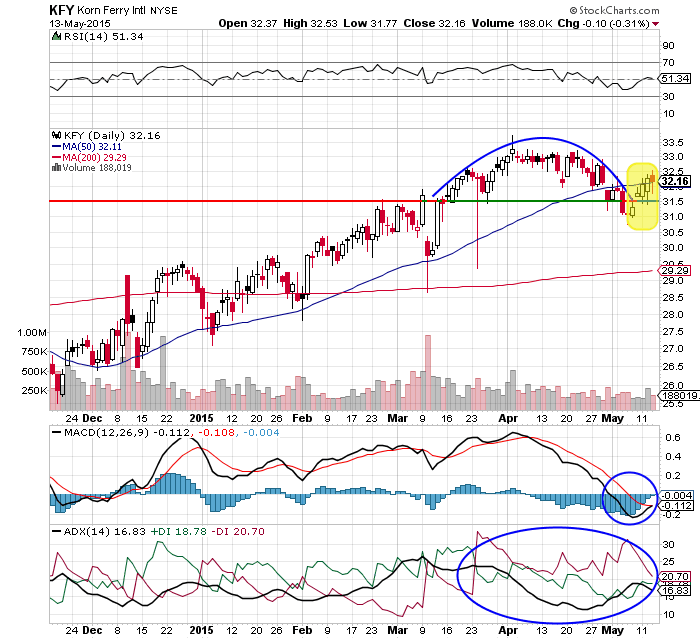
| A volatile rally of Korn/Ferry International (KFY) moved upward with the support of the 50-day moving average (MA) on the daily chart in Figure 1. The stock has formed a rounded top above $30. Although the rounded top is a bearish reversal pattern, KFY has not breached the 50-day MA support. Figure 1 shows that the share price is rallying around the moving average support. The rounded top has failed to undergo a bearish breakout. |

|
| Figure 1. Daily Chart Of Korn/Ferry International (KFY). The rounded-top pattern failed to break the support of its 50-day moving average. |
| Graphic provided by: StockCharts.com. |
| |
| However, the indicators used in Figure 1 are highlighting weak signals. The average directional index (ADX) has been jittery throughout the rally. Due to the unsteady buying and selling pressure, the trend indicator failed to develop either of the trends. Since late March 2015 the selling pressure (red line) in the ADX(14) has increased and as a result the vertical rally formed the rounded top in Figure 1. In addition, the moving average convergence/divergence (MACD)(12,26,9) turned negative and slipped below the zero line. The relative strength index (RSI)(14) remained range-bound between the 50 and 70 levels of the bullish areas. |
| The yellow box marked on the price chart in Figure 1 shows white candlesticks with uneven size along with small upper and lower shadows and a red candlestick as well. This suggests KFY is currently directionless, and therefore, would remain volatile for the next few days. |

|
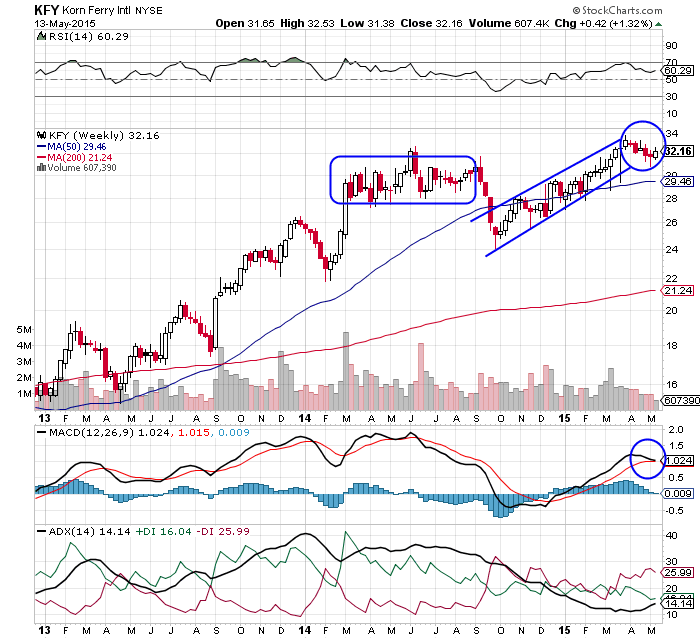
| Figure 2. Weekly Chart Of KFY. Here you see that the stock price is plunging toward its 50-day MA support. |
| Graphic provided by: StockCharts.com. |
| |
| The weekly chart in Figure 2 shows that KFY was in a long-term uptrend till late 2014. The price rally follows a pattern that could help to analyze its future road map. The stock consolidates and retraces toward the previous low after every upward rally. The price action that began in October 2014 hit the previous high at $33 in a time span of six months. Currently, KFY is retracing toward its 50-day MA. This could be due to the weak trend indicated by the ADX. The MACD and the RSI are bullish, therefore, price is likely to establish support at the moving average. |
| Therefore the 50-day MA would be the ultimate support. Considering the pattern, the stock is likely to initiate an upward rally from the support level. Since KFY has hit its previous high resistance of 2014, it is likely to witness high volatility in this region. Just to add more confidence in the possibility of a future rally, traders can refer to the monthly chart (not shown). KFY in is a long-term uptrend on the monthly chart, so it is likely that the stock would resume its previous upward rally. Traders can stay watchful for a fresh bullish breakout in the next few months. |
Active trader in the Indian stock markets since 2003 and a full-time writer. Trading is largely based upon technical analysis.
| Company: | Independent |
| Address: | C1/3 Parth Indraprasth Towers. Vastrapur |
| Ahmedabad, Guj 380015 | |
| E-mail address: | chaitalimohile@yahoo.co.in |
Traders' Resource Links | |
| Independent has not added any product or service information to TRADERS' RESOURCE. | |
Click here for more information about our publications!
PRINT THIS ARTICLE

Request Information From Our Sponsors
- StockCharts.com, Inc.
- Candle Patterns
- Candlestick Charting Explained
- Intermarket Technical Analysis
- John Murphy on Chart Analysis
- John Murphy's Chart Pattern Recognition
- John Murphy's Market Message
- MurphyExplainsMarketAnalysis-Intermarket Analysis
- MurphyExplainsMarketAnalysis-Visual Analysis
- StockCharts.com
- Technical Analysis of the Financial Markets
- The Visual Investor
- VectorVest, Inc.
- Executive Premier Workshop
- One-Day Options Course
- OptionsPro
- Retirement Income Workshop
- Sure-Fire Trading Systems (VectorVest, Inc.)
- Trading as a Business Workshop
- VectorVest 7 EOD
- VectorVest 7 RealTime/IntraDay
- VectorVest AutoTester
- VectorVest Educational Services
- VectorVest OnLine
- VectorVest Options Analyzer
- VectorVest ProGraphics v6.0
- VectorVest ProTrader 7
- VectorVest RealTime Derby Tool
- VectorVest Simulator
- VectorVest Variator
- VectorVest Watchdog
