HOT TOPICS LIST
- MACD
- Fibonacci
- RSI
- Gann
- ADXR
- Stochastics
- Volume
- Triangles
- Futures
- Cycles
- Volatility
- ZIGZAG
- MESA
- Retracement
- Aroon
INDICATORS LIST
LIST OF TOPICS
PRINT THIS ARTICLE
by Koos van der Merwe
Facebook, facebook, facebook — A company on almost everyone's computer, but does that mean you should invest in the stock?
Position: Accumulate
Koos van der Merwe
Has been a technical analyst since 1969, and has worked as a futures and options trader with First Financial Futures in Johannesburg, South Africa.
PRINT THIS ARTICLE
ELLIOTT WAVE
Another Look At Facebook
05/14/15 04:58:24 PMby Koos van der Merwe
Facebook, facebook, facebook — A company on almost everyone's computer, but does that mean you should invest in the stock?
Position: Accumulate
| Facebook is growing. It is a company that has taken the world by storm, and at the moment has no serious competitors. People are increasingly turning to social networks for news and information creating filter bubbles where people only see information from like-minded individuals. Companies like Twitter, Style and Wayne, Pinterest and others have grown, but have been unable to equal the social network Facebook offers. Friends from all over the world have found each other, and post pictures of themselves and family; where they live and what their interests are. The question is, is the stock a buy at the moment? |

|
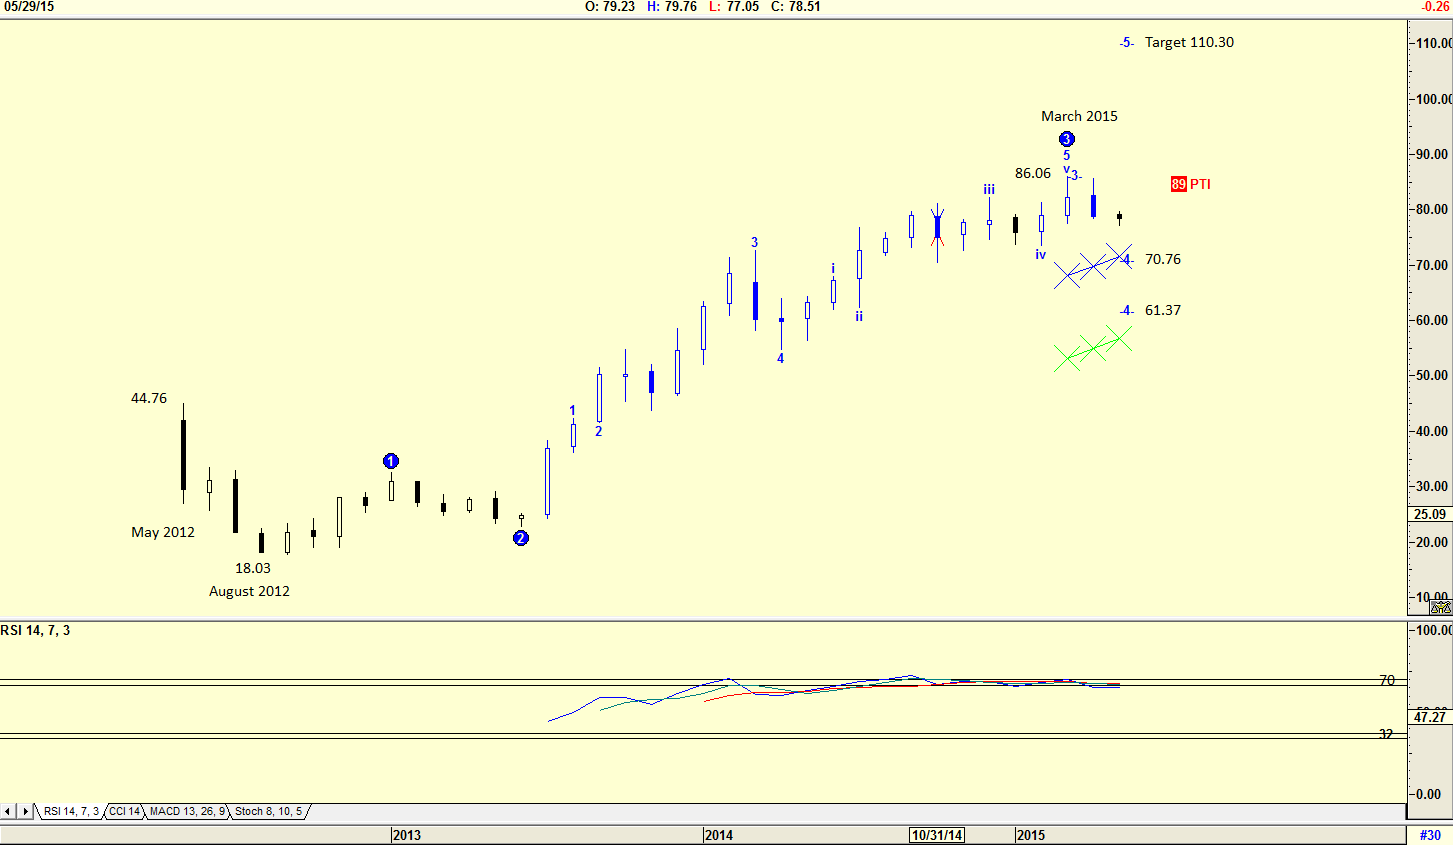
| Figure1. Monthly Chart. The monthly chart is suggesting a wave 4 correction. |
| Graphic provided by: AdvancedGET. |
| |
| The chart in Figure 1 is a monthly chart showing how the stock listed in May 2012 reached a high of $44.76 but promptly fell to a low of $18.03 by August 2012. The share price then started rising in what appears to be WAVE 3 of an Elliott wave count reaching a high of $86.06 by March 2015. The share price has since fallen in a WAVE 4, which is expected to bottom at either $70.76 or $61.37. Once WAVE 4 is complete, the stock price should rise in a WAVE 5 to a level of $110.30. The probability index (PTI) is high at 89%, suggesting that this could indeed take place. Note that the relative strength index (RSI) has broken below the 70 horizontal, suggesting a sell. |

|
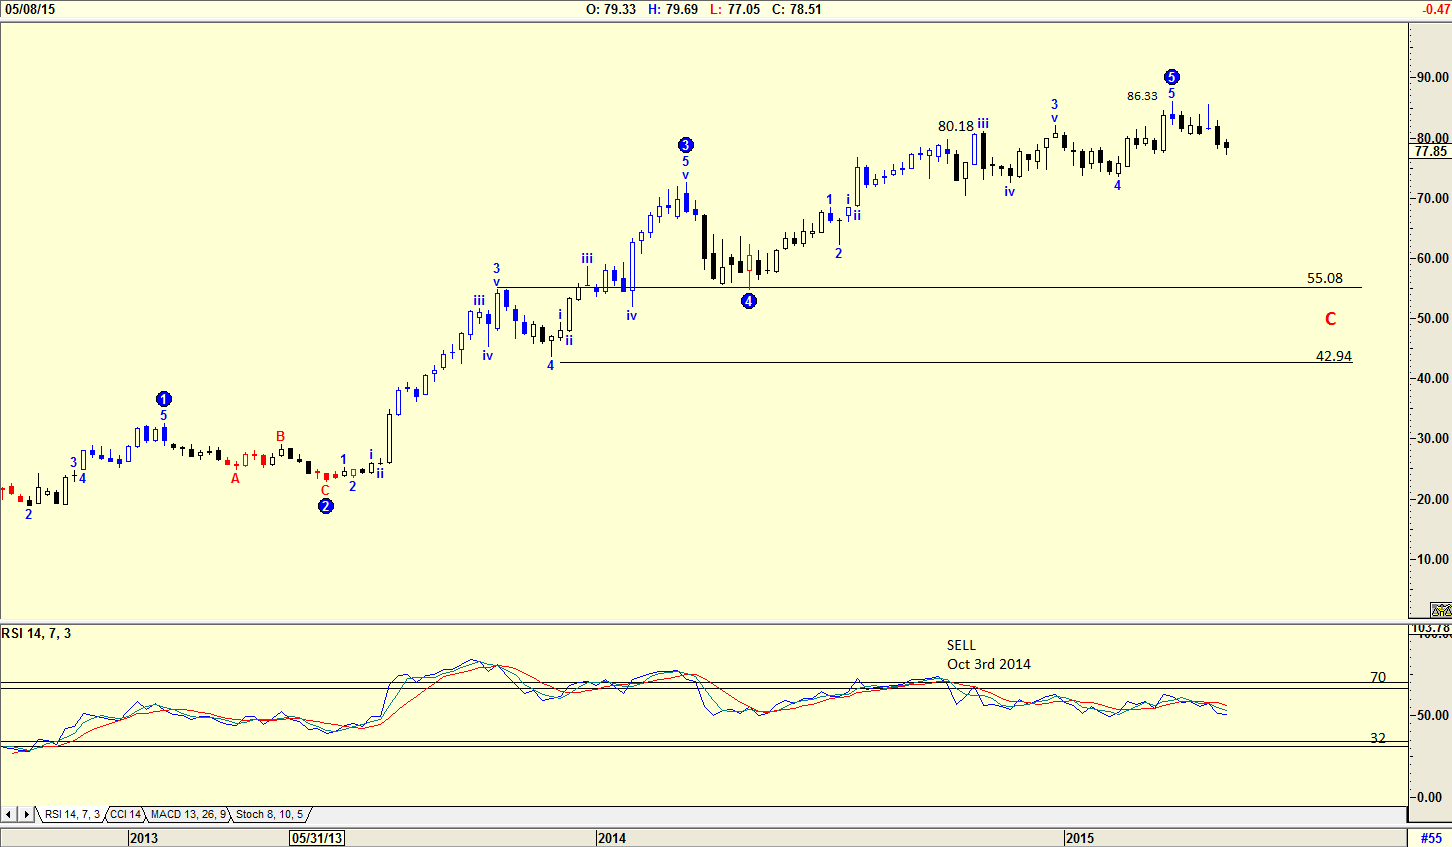
| Figure 2. Weekly Chart. The Elliott wave count suggests that a WAVE 5 has been completed and that the price could now fall into an ABC wave count. |
| Graphic provided by: AdvancedGET. |
| |
| The chart in Figure 2 is a weekly chart with an Elliott wave count suggesting that a WAVE 5 has been completed. The Elliott wave count is suggesting that the share price should now fall in an ABC wave count to somewhere between $55.08 and $42.94, the 4th wave of lesser degree. The RSI gave a sell signal on October 3, 2014 when the share price was at $80.18. |

|
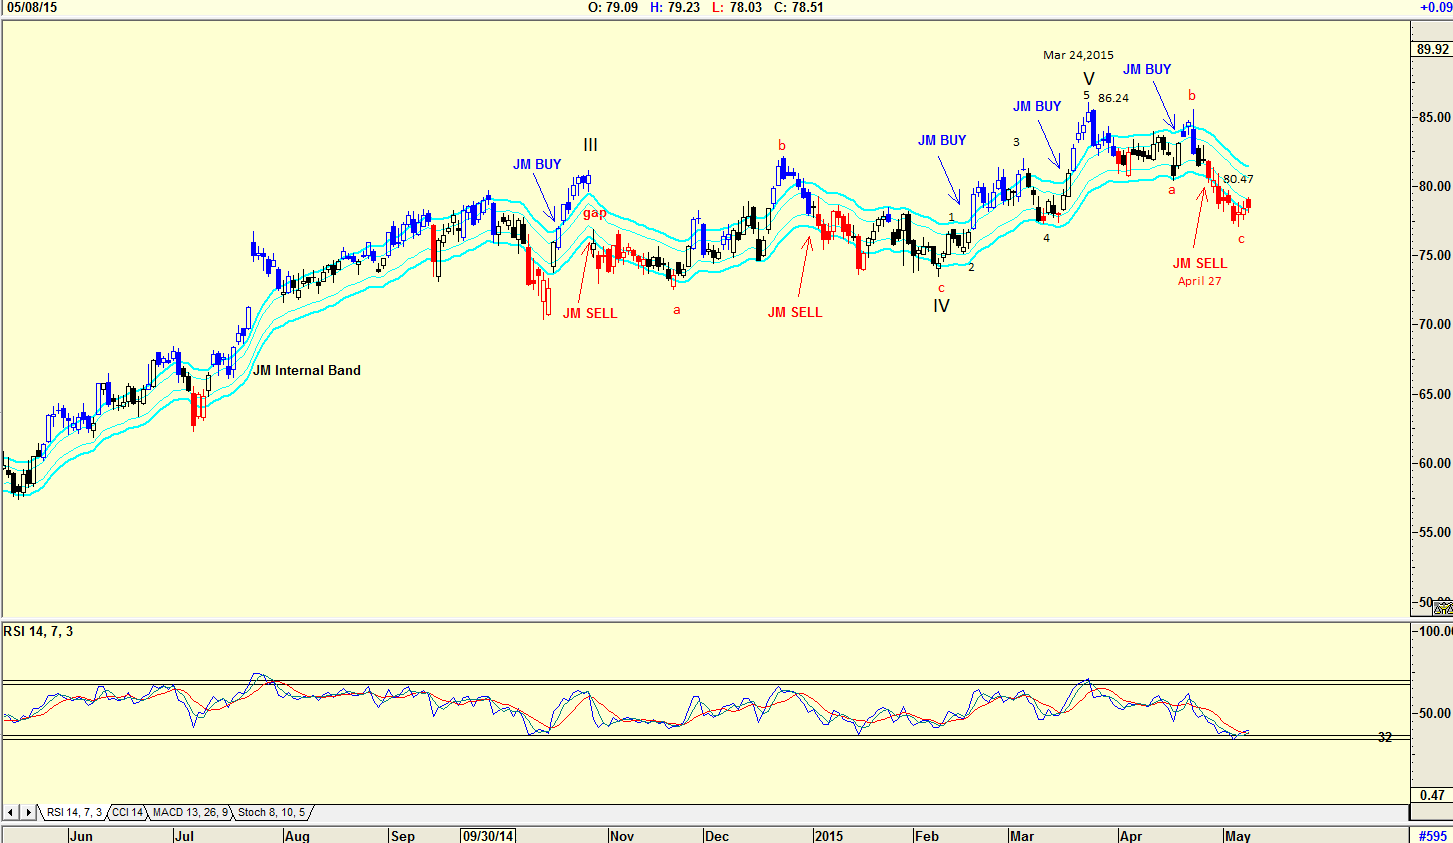
| Figure 3. Daily Chart. The JM internal band gave a sell signal on April 27, 2015. |
| Graphic provided by: AdvancedGET. |
| |
| The chart in Figure 3 is a daily chart with an Elliott wave count suggesting that a WAVE V topped out on March 24, 2015 at $86.24. The JM internal band gave a sell signal on April 27, 2015 when the price had fallen to $80.47. The JM internal band is a 15-period simple moving average offset by 2% positive and 2% negative. A move above the upper band suggests a buy signal, and a move below the lower band a sell signal. Note that the RSI is oversold and is suggesting a buy. Short-term traders could consider buying the stock at its current price, keeping stops close. Long term investors, however, should wait until a JM internal band buy signal is given. |
Has been a technical analyst since 1969, and has worked as a futures and options trader with First Financial Futures in Johannesburg, South Africa.
| Address: | 3256 West 24th Ave |
| Vancouver, BC | |
| Phone # for sales: | 6042634214 |
| E-mail address: | petroosp@gmail.com |
Click here for more information about our publications!
Comments
Date: 07/08/15Rank: 3Comment:

Request Information From Our Sponsors
- StockCharts.com, Inc.
- Candle Patterns
- Candlestick Charting Explained
- Intermarket Technical Analysis
- John Murphy on Chart Analysis
- John Murphy's Chart Pattern Recognition
- John Murphy's Market Message
- MurphyExplainsMarketAnalysis-Intermarket Analysis
- MurphyExplainsMarketAnalysis-Visual Analysis
- StockCharts.com
- Technical Analysis of the Financial Markets
- The Visual Investor
- VectorVest, Inc.
- Executive Premier Workshop
- One-Day Options Course
- OptionsPro
- Retirement Income Workshop
- Sure-Fire Trading Systems (VectorVest, Inc.)
- Trading as a Business Workshop
- VectorVest 7 EOD
- VectorVest 7 RealTime/IntraDay
- VectorVest AutoTester
- VectorVest Educational Services
- VectorVest OnLine
- VectorVest Options Analyzer
- VectorVest ProGraphics v6.0
- VectorVest ProTrader 7
- VectorVest RealTime Derby Tool
- VectorVest Simulator
- VectorVest Variator
- VectorVest Watchdog
