

HOT TOPICS LIST
- MACD
- Fibonacci
- RSI
- Gann
- ADXR
- Stochastics
- Volume
- Triangles
- Futures
- Cycles
- Volatility
- ZIGZAG
- MESA
- Retracement
- Aroon
INDICATORS LIST
LIST OF TOPICS
PRINT THIS ARTICLE
by Donald W. Pendergast, Jr.
After a stunning 3,600% rally since November 2008, shares of Wyndham Worldwide are primed for a major correction.
Position: N/A
Donald W. Pendergast, Jr.
Freelance financial markets writer and online publisher of the Trendzetterz.com S&P 500 Weekly Forecast service.
PRINT THIS ARTICLE
CYCLES
WYN: Monthly Sell Signal At Major Cycle High
05/12/15 04:28:50 PMby Donald W. Pendergast, Jr.
After a stunning 3,600% rally since November 2008, shares of Wyndham Worldwide are primed for a major correction.
Position: N/A
| Every once in a while, a near-ideal set of stock market dynamics coalesce around a specific stock, with the result being an epic, multiyear rally of stupendous proportions. That appears to be the case with shares of Wyndham Worldwide Corp. (WYN) as it soared from a bargain-basement valuation of $2.55 per share to $94.35 in the span of 6 1/2 years. That's a 3,600% increase, not something witnessed in the large-cap survivors of the incredible crash of late 2007 to early 2008. All major rallies end at some point, and the stage now appears to be set for WYN to move down to at least the lower $70.00 range before it meets up with a major demand zone (a price zone associated with previously heavy buy/sell volumes); here's a closer look. |
|
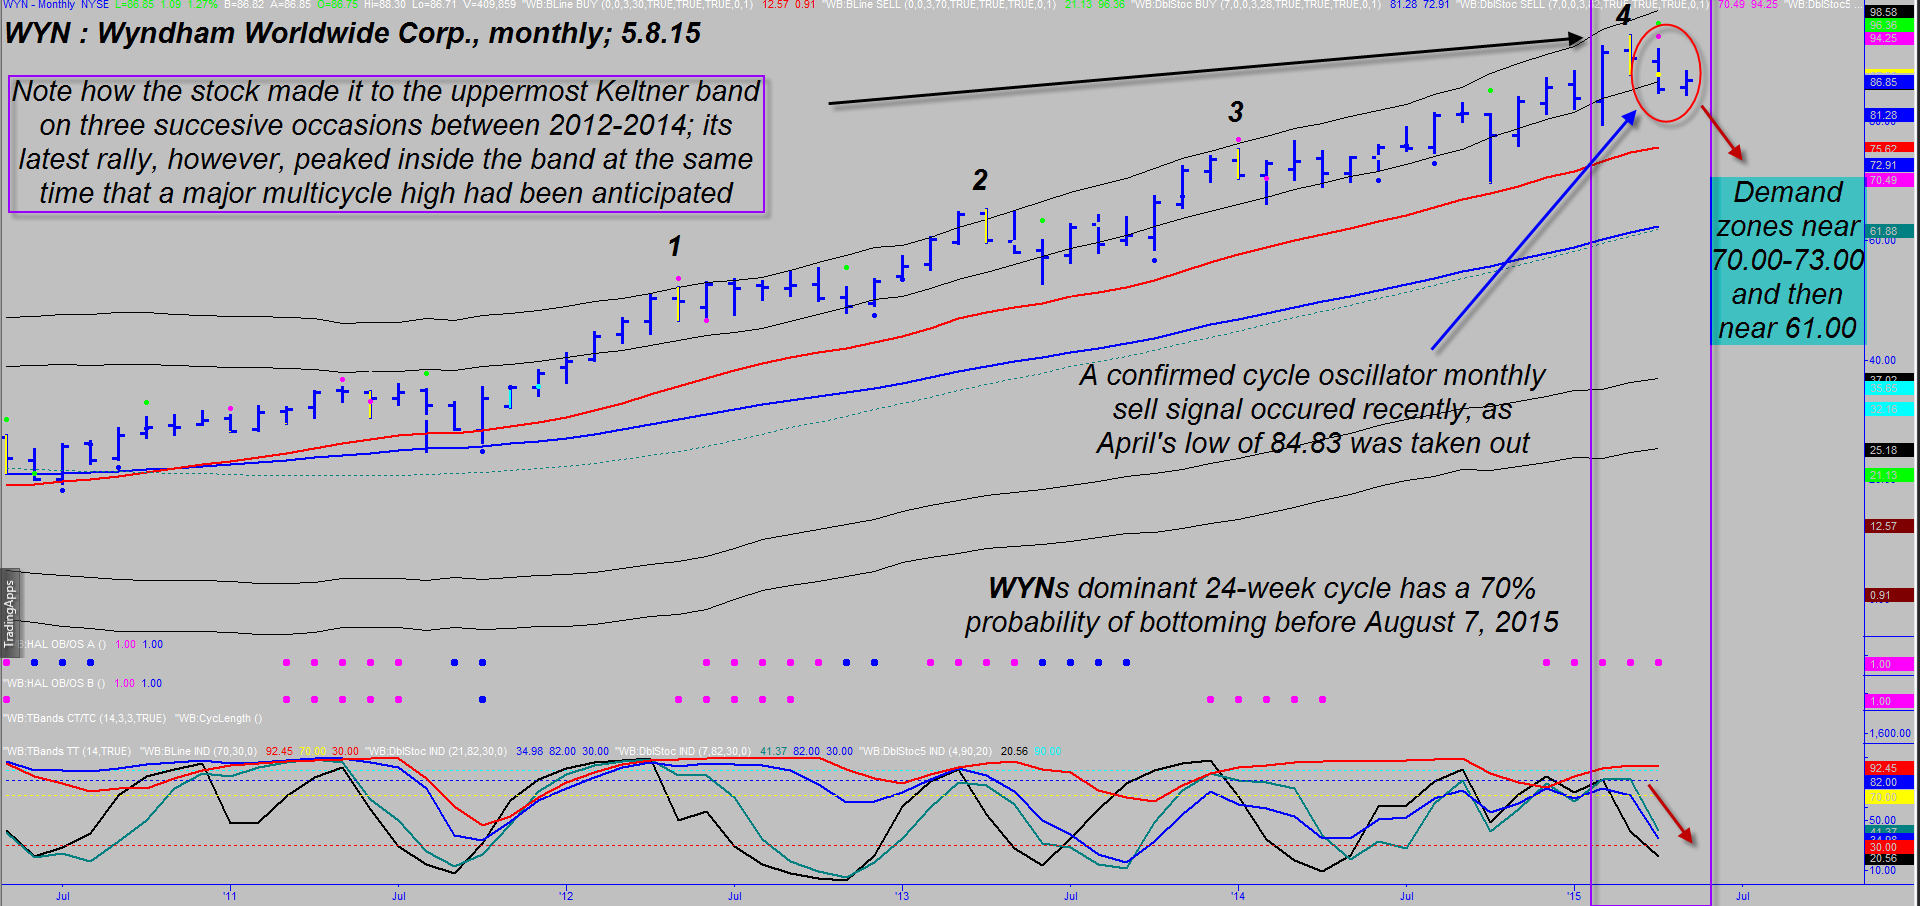
| Figure 1. Monthly Chart Of Wyndham Worldwide Corp. (WYN). WYN experienced a noticeable loss of upside momentum as the fourth swing on the chart failed to reach the uppermost Keltner band. |
| Graphic provided by: TradeStation. |
| Graphic provided by: ProfitTrader7 from www.walterbressert.com. |
| |
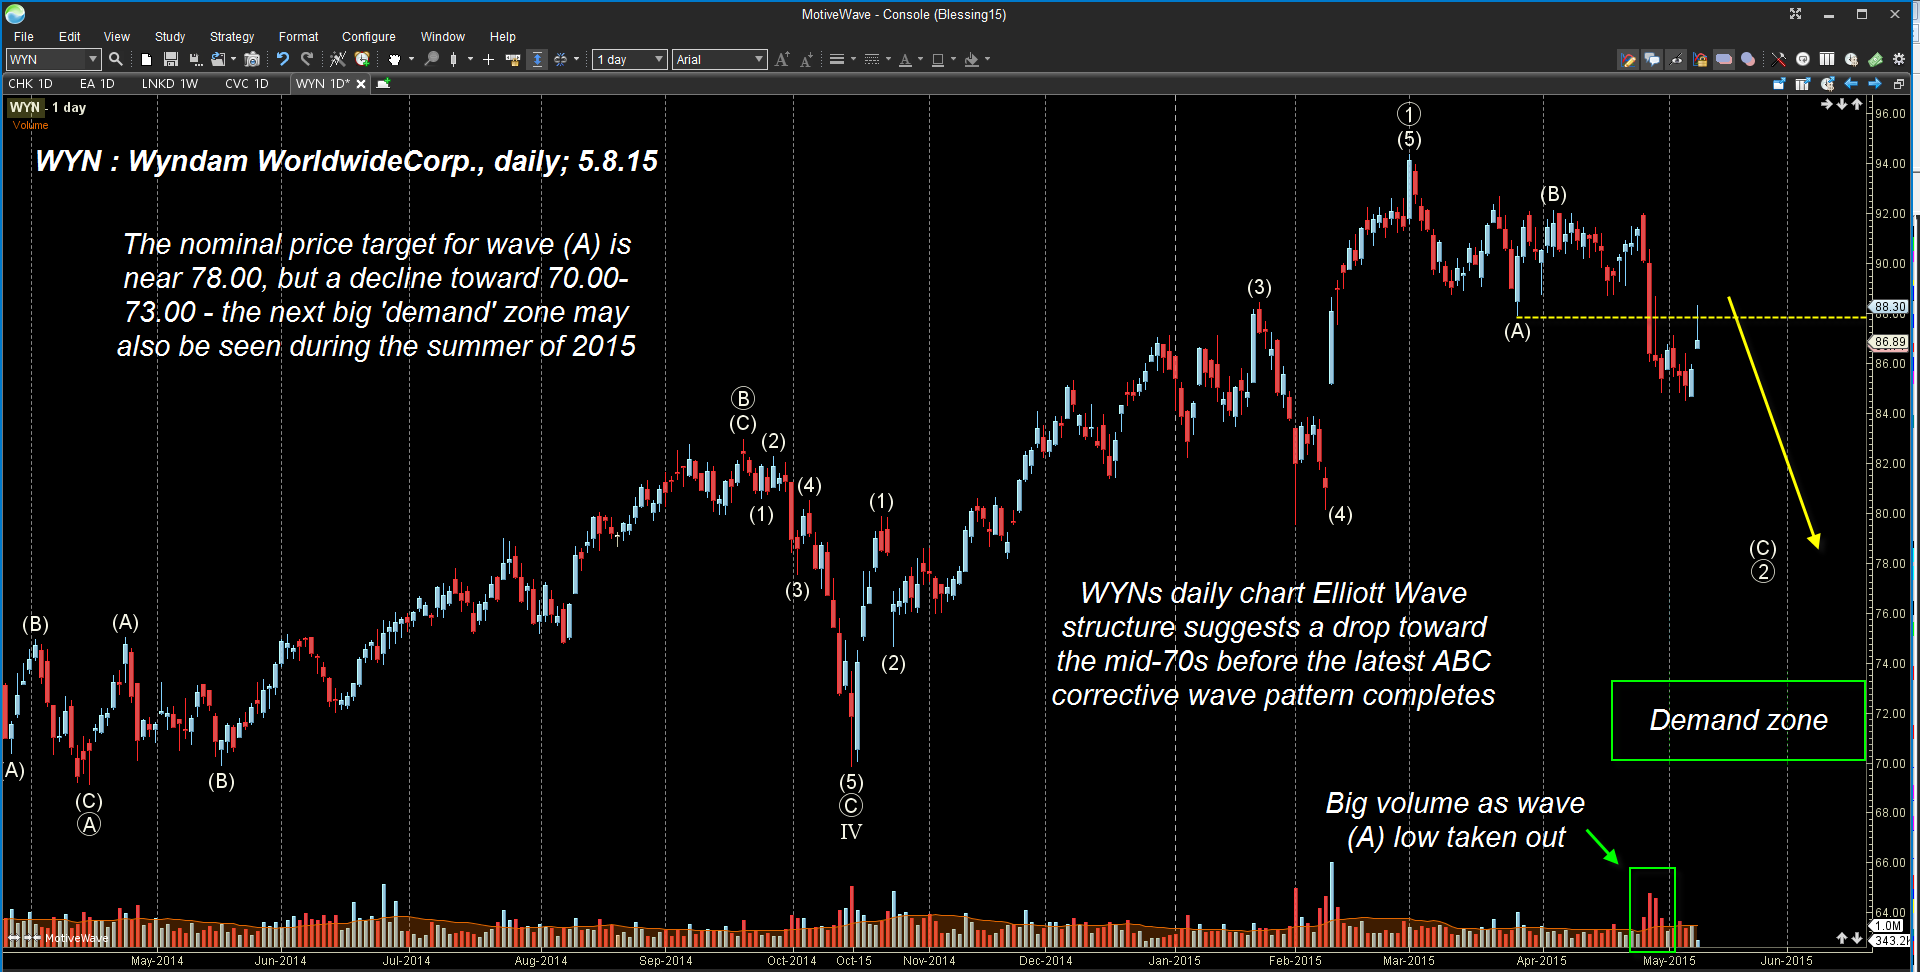
| A simple yet effective way to use Keltner bands on a long term (weekly or monthly) trending stock is to take note of the location of each successive swing high (or swing low in downtrends) in relation to an extreme Keltner band. Doing so can be used to help ascertain: 1. Loss of upside/downside momentum 2. A way to confirm an anticipated major cycle high or low On WYN's monthly chart in Figure 1 note the four successive major swing/cycles highs; the first three peaked and reversed at or near the uppermost band, but the fourth and final one saw WYN peak and reverse well below the top band — and right within the forecasted time window for the stock to make a major high, no less. And so far, this does appear to be the start of a potentially major correction: A. WYN now has a 70% chance of making its next 24-week cycle low by August 7, 2015 — and a 30% probability of bottoming even later. B. Even the mid-cycle forecast does not anticipate WYN bottoming until the final week of June 2015. C. Strong buying demand is not anticipated until WYN drops within the range of 70.00-73.00; there is also a major demand zone in the lower $60.00 range. D. WYN's weekly chart (not shown) reveals extreme distribution patterns (market insiders and big institutions selling their shares to latecomer retail investors). This is a potent predictive market dynamic that almost always precedes a big selloff in a given stock. E. WYN's daily chart in Figure 2 shows us an Elliott wave ABC corrective pattern already underway; the nominal wave (A) price target is near $78.00 at a minimum. Taken as a whole, this technical mix is suggesting that there is plenty more downside left in WYNs developing correction. Until either of the previously mentioned demand zones are reached, WYN is not a viable candidate for new long entries; existing longs should consider selling and going to cash, as well, unless they are absolutely convinced of much higher prices to come in the second half of 2015. |
|
| Figure 2. Daily Chart Of WYN. Here the Elliott wave pattern reveals a likely ABC corrective wave pattern unfolding. The minimum target for wave (A) is near $78.00. |
| Graphic provided by: MotiveWave Trading Software at www.motivewave.com. |
| |
| Speculative bears might consider the purchase of slightly in-the-money put options with four to six months of time value until expiration; this can allow for significant staying power should there be a modest bounce here before the next wave of selling begins. Keep your account risk on the trade at 2% or less and trade wisely until we meet here again. |
Freelance financial markets writer and online publisher of the Trendzetterz.com S&P 500 Weekly Forecast service.
| Title: | Market consultant and writer |
| Company: | Trendzetterz |
| Address: | 81 Hickory Hollow Drive |
| Crossville, TN 38555 | |
| Phone # for sales: | 904-303-4814 |
| Website: | trendzetterz.com |
| E-mail address: | support@trendzetterz.com |
Traders' Resource Links | |
| Trendzetterz has not added any product or service information to TRADERS' RESOURCE. | |
Click here for more information about our publications!
PRINT THIS ARTICLE

Request Information From Our Sponsors
- StockCharts.com, Inc.
- Candle Patterns
- Candlestick Charting Explained
- Intermarket Technical Analysis
- John Murphy on Chart Analysis
- John Murphy's Chart Pattern Recognition
- John Murphy's Market Message
- MurphyExplainsMarketAnalysis-Intermarket Analysis
- MurphyExplainsMarketAnalysis-Visual Analysis
- StockCharts.com
- Technical Analysis of the Financial Markets
- The Visual Investor
- VectorVest, Inc.
- Executive Premier Workshop
- One-Day Options Course
- OptionsPro
- Retirement Income Workshop
- Sure-Fire Trading Systems (VectorVest, Inc.)
- Trading as a Business Workshop
- VectorVest 7 EOD
- VectorVest 7 RealTime/IntraDay
- VectorVest AutoTester
- VectorVest Educational Services
- VectorVest OnLine
- VectorVest Options Analyzer
- VectorVest ProGraphics v6.0
- VectorVest ProTrader 7
- VectorVest RealTime Derby Tool
- VectorVest Simulator
- VectorVest Variator
- VectorVest Watchdog