HOT TOPICS LIST
- MACD
- Fibonacci
- RSI
- Gann
- ADXR
- Stochastics
- Volume
- Triangles
- Futures
- Cycles
- Volatility
- ZIGZAG
- MESA
- Retracement
- Aroon
INDICATORS LIST
LIST OF TOPICS
PRINT THIS ARTICLE
by Koos van der Merwe
When the price of a share falls like a stone, do you catch a falling knife?
Position: Sell
Koos van der Merwe
Has been a technical analyst since 1969, and has worked as a futures and options trader with First Financial Futures in Johannesburg, South Africa.
PRINT THIS ARTICLE
TECHNICAL ANALYSIS
Is LinkedIn Now A Buy?
05/06/15 02:02:01 PMby Koos van der Merwe
When the price of a share falls like a stone, do you catch a falling knife?
Position: Sell
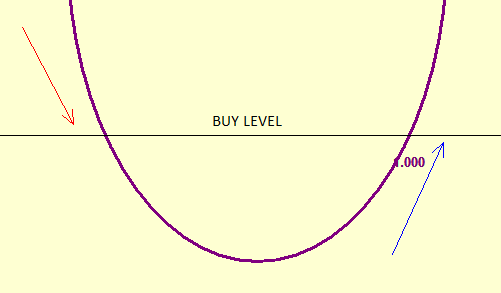
| The mantra is, "Never catch a falling knife." In other words, if the price of a stock falls, do you try and determine its support level and buy the share as it is falling, or do you wait for the stock price to form a solid foundation, and only then start nibbling at it as the stock price starts recovering? Statistics suggest that it is always better to buy a stock as it starts recovering and moving up. |

|
| Figure 1. Never Catch A Falling Knife. It is always better to buy a stock as it starts recovering and moving up. |
| Graphic provided by: AdvancedGET. |
| |
| Looking at Figure 1, if you bought the share as the price fell at the buy level, you may have many sleepless nights since there were stop loss orders that were triggered. However, if you bought the stock at the same buy level but as the price rose, no stop losses would be hit and you would sleep well. |

|
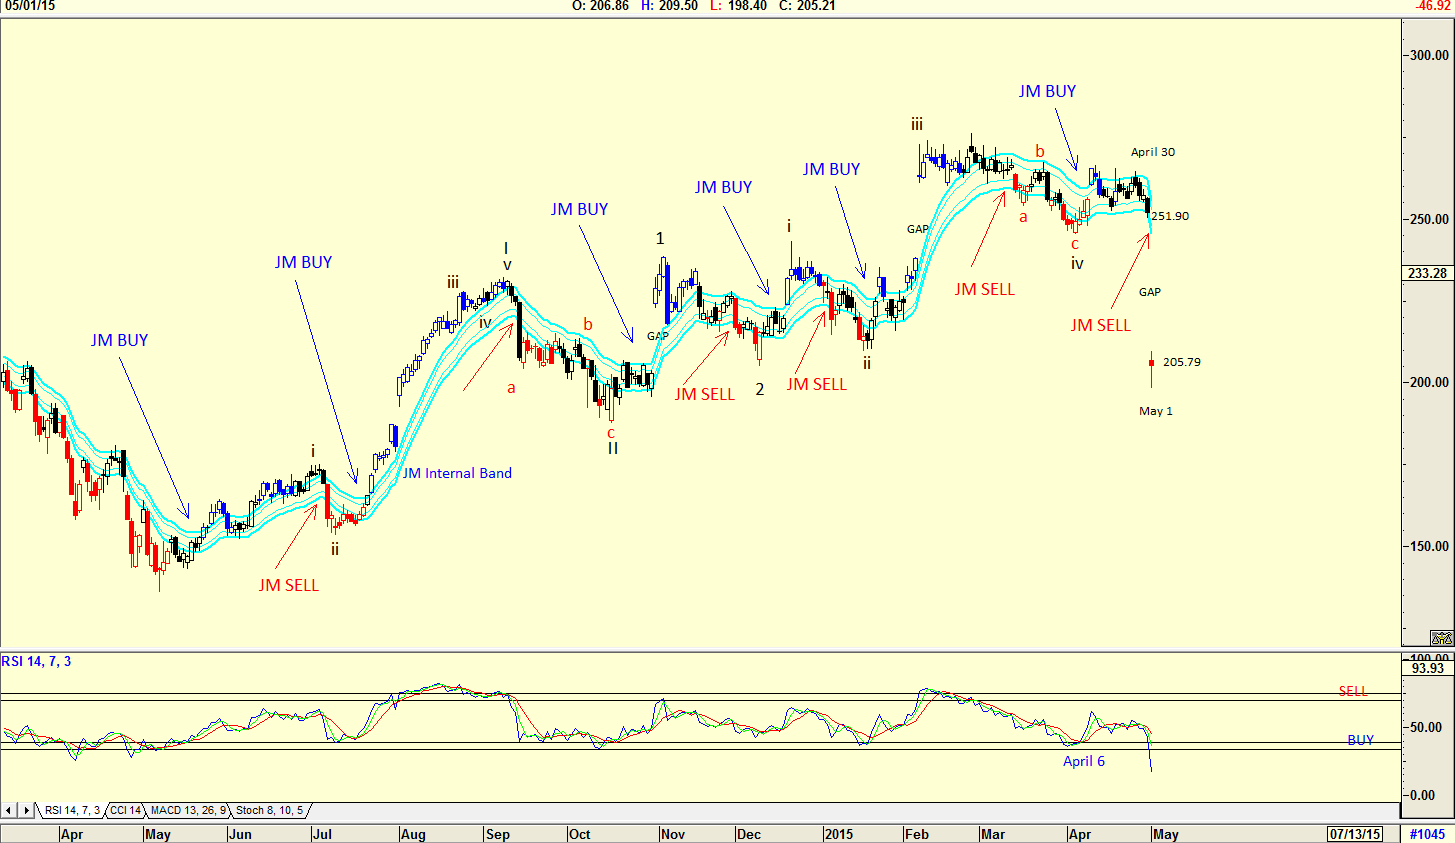
| Figure 2. Daily Chart Of LinkedIn (LNKD). The Elliott wave count didn't work out as expected; the RSI also gave a buy signal on April 6, 2015. What went wrong? |
| Graphic provided by: AdvancedGET. |
| |
| Looking at the daily chart of LinkedIn (LNKD) in Figure 2 you can see how the price fell from $251.90 to $205.79 on May 1, 2015. We all know that the share price should now rise to fill the gap, but when will that happen? The stock price should start consolidating at the low level before rising. The Elliott wave count shown on the chart has, with the fall on May 1, 2015, proved to be wrong. But then you must never forget that an Elliott wave count is purely a signpost in the wilderness and can change direction a little way down the road. Finally note that the JM internal band only gave a sell signal on May 1, 2015 with the collapse in price. The JM internal band is a 15-period simple moving average offset by 2% positive and 2% negative. A buy signal is given when the share price moves above the upper band, and a sell signal is given when it moves below the lower band. Note that the relative strength index (RSI) gave a buy signal on April 6, 2015 so technically, everything suggests that LNKD should continue rising, but it did not. Instead, it collapsed. So what went wrong? Could the collapse in price have been foreseen? |

|
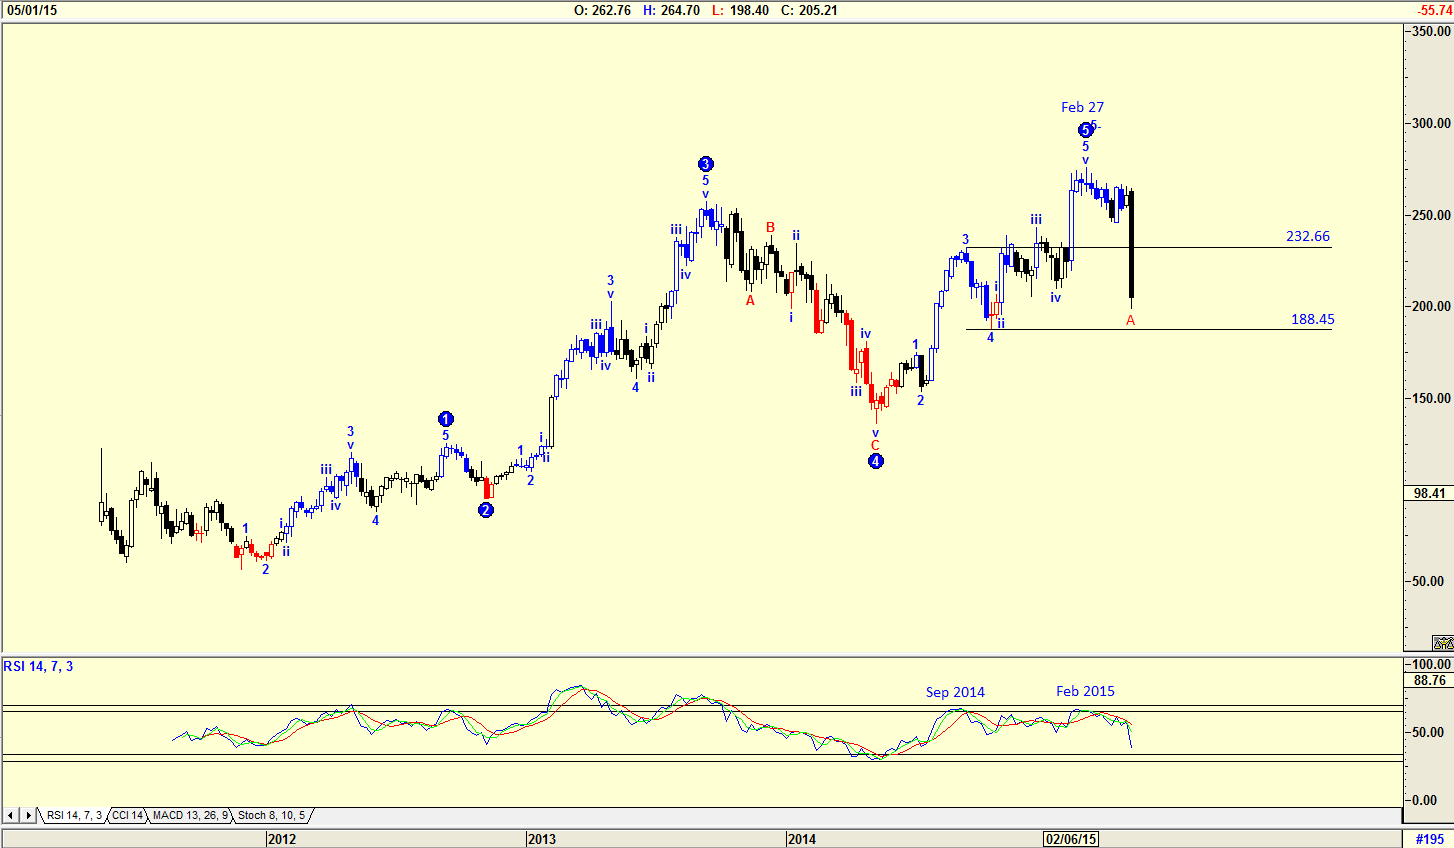
| Figure 3. Weekly Chart Of LNKD. Here you see that the Elliott wave did suggest that a correction was about to take place. The RSI also suggested a sell. |
| Graphic provided by: AdvancedGET. |
| |
| The chart in Figure 3 is a weekly chart with an Elliott wave count that did foresee the fall in price. The Elliott wave 5 topped on February 27, 2015 suggesting that a correction was to happen. With the correction on May 1, 2015 to the fourth wave of lesser degree, between the levels of $188.45 and $232.66, the share price could start rising, but that is not certain. A consolidation at this level would be the way to go. Note that the RSI suggested a sell for the second time; the first time was in September 2014 and the second time was in February 2015. With the collapse of the stock price on May 1, 2015 you may be tempted to buy the stock, but remember, never try to catch a falling knife. It is always preferable to wait and see what happens. The charts also show that when you are evaluating whether or not to buy a stock, you should always analyze a weekly chart as well. The daily and weekly charts should complement each other, in that they should both move in the same direction. |
Has been a technical analyst since 1969, and has worked as a futures and options trader with First Financial Futures in Johannesburg, South Africa.
| Address: | 3256 West 24th Ave |
| Vancouver, BC | |
| Phone # for sales: | 6042634214 |
| E-mail address: | petroosp@gmail.com |
Click here for more information about our publications!
Comments
Date: 05/06/15Rank: 5Comment: Very useful information that can be applied to one s own stock selection criteria.

Request Information From Our Sponsors
- VectorVest, Inc.
- Executive Premier Workshop
- One-Day Options Course
- OptionsPro
- Retirement Income Workshop
- Sure-Fire Trading Systems (VectorVest, Inc.)
- Trading as a Business Workshop
- VectorVest 7 EOD
- VectorVest 7 RealTime/IntraDay
- VectorVest AutoTester
- VectorVest Educational Services
- VectorVest OnLine
- VectorVest Options Analyzer
- VectorVest ProGraphics v6.0
- VectorVest ProTrader 7
- VectorVest RealTime Derby Tool
- VectorVest Simulator
- VectorVest Variator
- VectorVest Watchdog
- StockCharts.com, Inc.
- Candle Patterns
- Candlestick Charting Explained
- Intermarket Technical Analysis
- John Murphy on Chart Analysis
- John Murphy's Chart Pattern Recognition
- John Murphy's Market Message
- MurphyExplainsMarketAnalysis-Intermarket Analysis
- MurphyExplainsMarketAnalysis-Visual Analysis
- StockCharts.com
- Technical Analysis of the Financial Markets
- The Visual Investor
