

HOT TOPICS LIST
- MACD
- Fibonacci
- RSI
- Gann
- ADXR
- Stochastics
- Volume
- Triangles
- Futures
- Cycles
- Volatility
- ZIGZAG
- MESA
- Retracement
- Aroon
INDICATORS LIST
LIST OF TOPICS
PRINT THIS ARTICLE
by Donald W. Pendergast, Jr.
After enduring a 62% decline over the past 26 months, shares of Diamond Offshore Drilling are reversing higher.
Position: N/A
Donald W. Pendergast, Jr.
Freelance financial markets writer and online publisher of the Trendzetterz.com S&P 500 Weekly Forecast service.
PRINT THIS ARTICLE
Diamond Offshore Drilling: Major Bullish Reversal
05/04/15 06:07:48 PMby Donald W. Pendergast, Jr.
After enduring a 62% decline over the past 26 months, shares of Diamond Offshore Drilling are reversing higher.
Position: N/A
| The collapse of crude oil between June 2014 and March 2015 caused a massive downward revaluation of most oil exploration, oil producer, and oil services stocks; shares of Diamond Offshore Drilling (DO) were hit especially hard, plunging by more than 50% between May 2014 and April 2015. WTI crude oil is still trading below $60.00 per barrel, but is up from the lower $40 range over the past few months, and this is helping set the stage for what could be a powerful bullish trend reversal for DO. Here's a closer look now. |
|
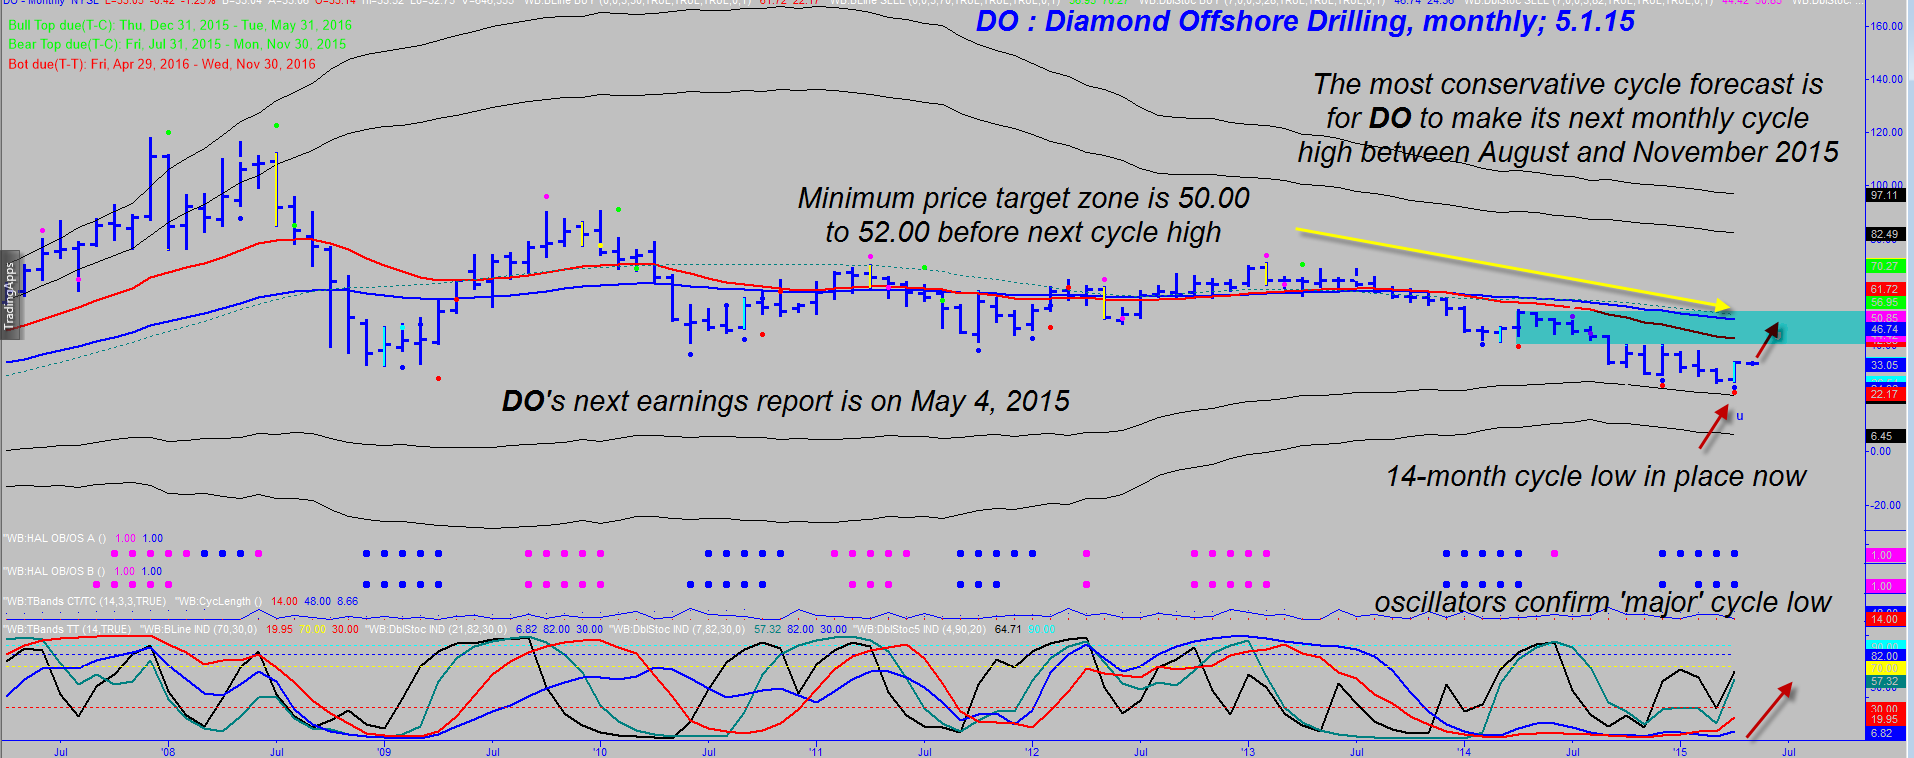
| Figure 1. Monthly Chart Of Diamond Offshore Drilling (DO). This energy stock has finally put in a major monthly chart cycle low, with several months of more gains being highly probable until the cycle peaks out. |
| Graphic provided by: TradeStation. |
| Graphic provided by: ProfitTrader7 from www.walterbressert.com. |
| |
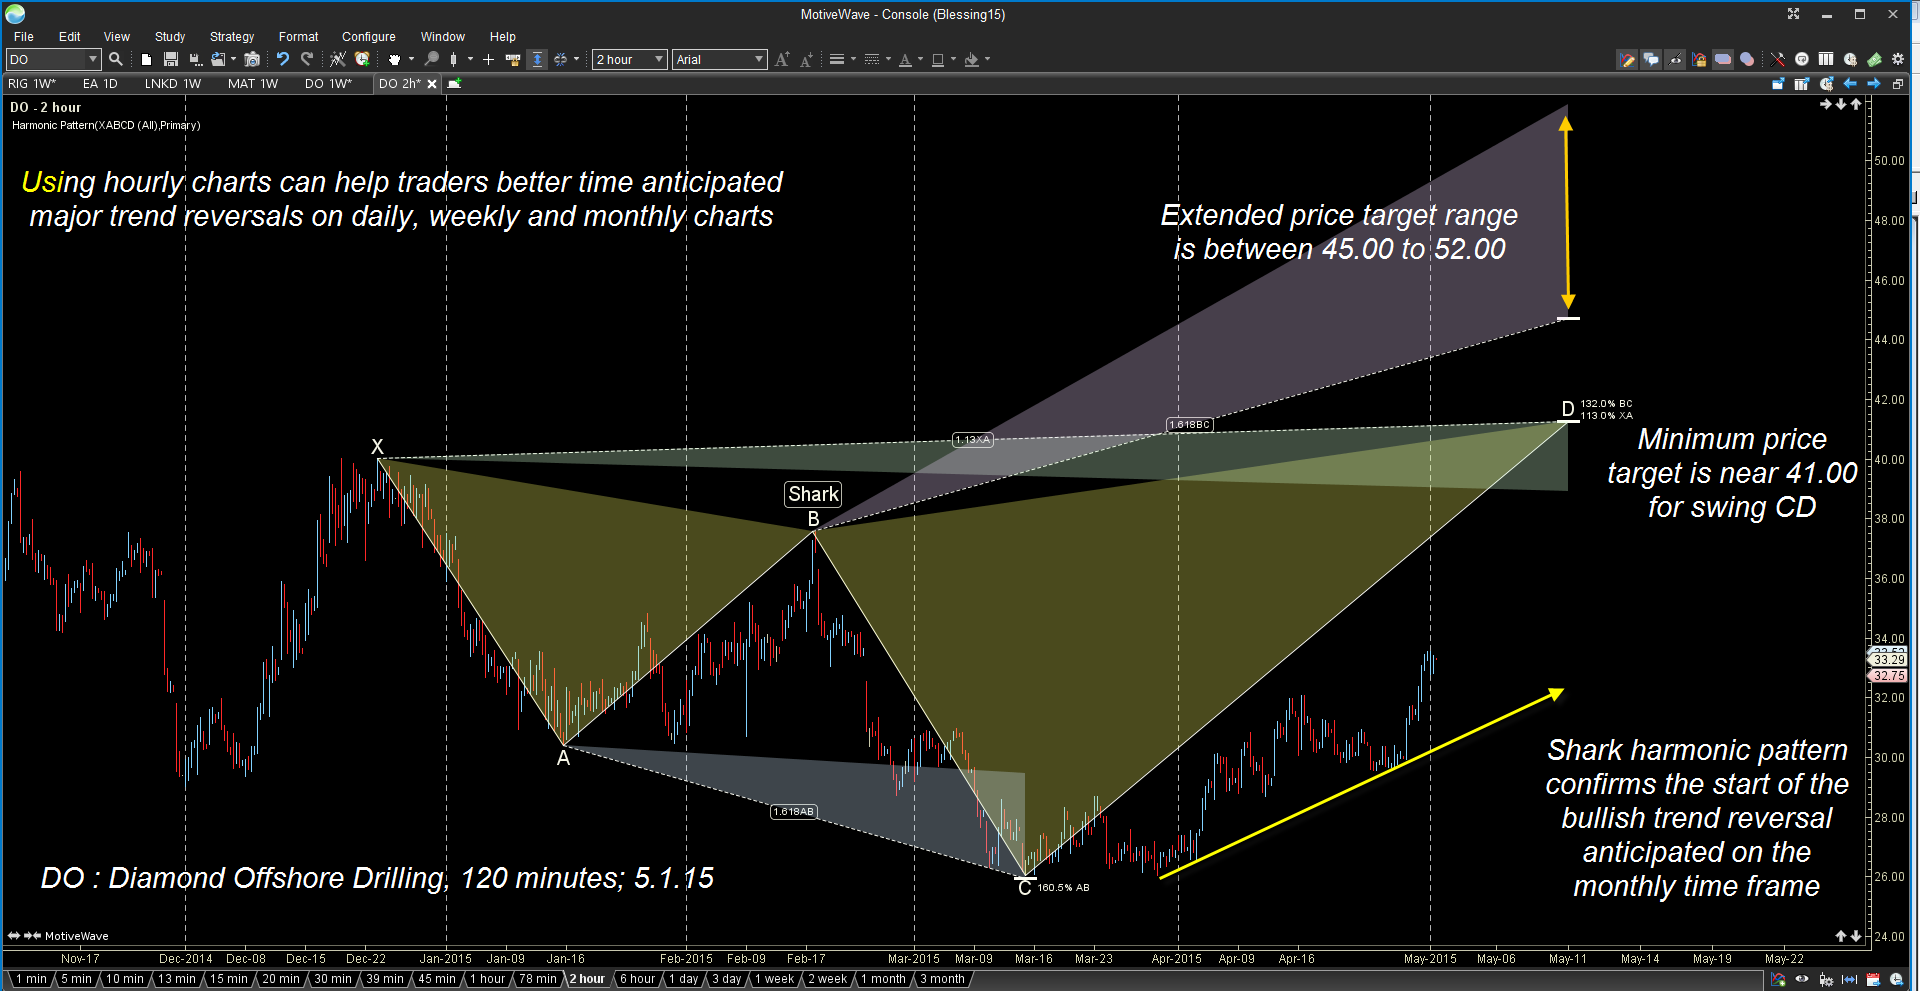
| DO's monthly chart in Figure 1 reveals that its dominant 14-bar price cycle (measured from trough to trough) is right on time; the dead low occurred on the monthly price bar for April 2015 and that same monthly bar has also produced no less than three cycle-based oscillator buy setup signals — all of which will trigger a valid long entry signal on a rally back above 33.57. Note that the cycle low and buy setup signals have occurred as DO found support near one of its lower Keltner bands, which is even more bullish. Here are the other technicals, all of which suggest a possible rise into at least the lower $40 range — if not the $50 range — in the near future: 1. A classic bullish price/money flow divergence is already proving out on the weekly chart (Figure 2), based on the 21-week Chaikin money flow histogram (CMF)(21). 2. A powerful bullish breakout from a mid-cycle pause has appeared on the weekly chart, and this is suggestive of at least another three to six weeks of rally potential. 3. All four of the primary cycle oscillators have turned bullish simultaneously and are moving sharply higher. 4. On the weekly chart, note that each successive cycle low managed to pull away from the bottommost Keltner band as the long decline progressed. This showed that downside momentum was slowly waning and that a reversal was in the making. 5. Cycle studies on the monthly chart suggest that DO has a 70% chance of making its next cycle high before November 30, 2015, with the most likely time being between August 1 and November 30, 2015. This monthly reversal definitely has room to run higher, based on this study. 6. DO's two hour chart (120 minutes) in Figure 3 shows us a beautiful Shark harmonic pattern, one that has plenty of room to run until its nominal price target of 41.00 is achieved. This pattern clearly confirms the validity of the emerging reversal on the monthly chart and is a powerful bullish omen for the stock going forward. |

|
| Figure 2. Weekly Chart Of DO. the weekly chart also offers convincing evidence in support of a bullish reversal that is just beginning. Note the price action along the lower Keltner bands as the downtrend plays out. |
| Graphic provided by: TradeStation. |
| Graphic provided by: ProfitTrader7 from www.walterbressert.com. |
| |
| Many other stocks/ETFs in the energy sector space are also manifesting similar bottoming/reversal setups, too, such as these tickers: OIH, IEO, IEZ, USO, ESV, RDC, RIG, HES, CLR, ATW, and other energy related large caps. Do your own homework and see which ones have the best cycle, money flow, chart pattern, and support/resistance dynamics and you too may also be able to locate some bullish gems amidst the rubble of the recent energy sector crash. Trade wisely until we meet here again. |
|
| Figure 3. Shark Harmonic Pattern. DO's 120-minute chart features this well-proportioned Shark harmonic pattern; the CD swing has a nominal price target of 41.00. Always look for signs of an emerging daily/weekly/monthly reversal on smaller time frames (60-, 90-, or 120-minutes) to help give you an added edge in the markets. |
| Graphic provided by: MotiveWave Ultimate by www.motivewave.com. |
| |
Freelance financial markets writer and online publisher of the Trendzetterz.com S&P 500 Weekly Forecast service.
| Title: | Market consultant and writer |
| Company: | Trendzetterz |
| Address: | 81 Hickory Hollow Drive |
| Crossville, TN 38555 | |
| Phone # for sales: | 904-303-4814 |
| Website: | trendzetterz.com |
| E-mail address: | support@trendzetterz.com |
Traders' Resource Links | |
| Trendzetterz has not added any product or service information to TRADERS' RESOURCE. | |
Click here for more information about our publications!
PRINT THIS ARTICLE

Request Information From Our Sponsors
- StockCharts.com, Inc.
- Candle Patterns
- Candlestick Charting Explained
- Intermarket Technical Analysis
- John Murphy on Chart Analysis
- John Murphy's Chart Pattern Recognition
- John Murphy's Market Message
- MurphyExplainsMarketAnalysis-Intermarket Analysis
- MurphyExplainsMarketAnalysis-Visual Analysis
- StockCharts.com
- Technical Analysis of the Financial Markets
- The Visual Investor
- VectorVest, Inc.
- Executive Premier Workshop
- One-Day Options Course
- OptionsPro
- Retirement Income Workshop
- Sure-Fire Trading Systems (VectorVest, Inc.)
- Trading as a Business Workshop
- VectorVest 7 EOD
- VectorVest 7 RealTime/IntraDay
- VectorVest AutoTester
- VectorVest Educational Services
- VectorVest OnLine
- VectorVest Options Analyzer
- VectorVest ProGraphics v6.0
- VectorVest ProTrader 7
- VectorVest RealTime Derby Tool
- VectorVest Simulator
- VectorVest Variator
- VectorVest Watchdog