HOT TOPICS LIST
- MACD
- Fibonacci
- RSI
- Gann
- ADXR
- Stochastics
- Volume
- Triangles
- Futures
- Cycles
- Volatility
- ZIGZAG
- MESA
- Retracement
- Aroon
INDICATORS LIST
LIST OF TOPICS
PRINT THIS ARTICLE
by David Penn
Since its October 10th bottom, the S&P 500 has been half uptrend and half consolidation. But now, the S&P 500 is all top.
Position: N/A
David Penn
Technical Writer for Technical Analysis of STOCKS & COMMODITIES magazine, Working-Money.com, and Traders.com Advantage.
PRINT THIS ARTICLE
HEAD & SHOULDERS
The S&P 500's 60-minute Complex Head and Shoulders Top
11/12/02 01:29:48 PMby David Penn
Since its October 10th bottom, the S&P 500 has been half uptrend and half consolidation. But now, the S&P 500 is all top.
Position: N/A
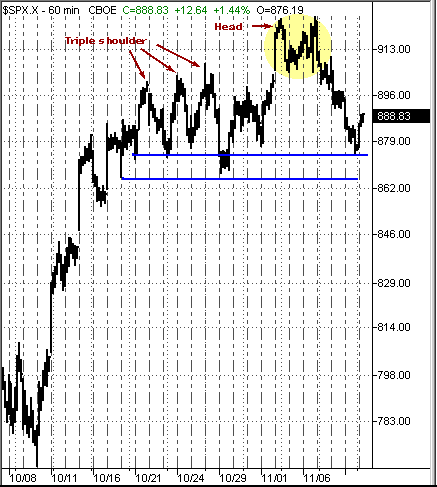
| There appear to have been three components of the S&P 500's powerful, 150-point rally that began on October 10th. The first leg of this rally sent the S&P 500 up like a shot, moving from 768 on October 10th to a high of 900 on October 21st. The second leg of the rally took place over the next few days, more specifically from the 21st to the 29th of October, as the S&P 500 oscillated between 903 and 867. The third, and apparently final, leg of the rally lasted from October 29th to about the 6th of November, as the S&P 500 moved from the bottom of its previous week-long range to a peak of 925--a mark that meets, but did not quite exceed, the high of the month of September. |
| There were a number of fundamental and other events that accompanied the S&P 500's move up: a 50 basis point Fed funds rate reduction, the GOP sweep of Congress, and a stern, unanimous United Nations resolution against Iraq. But whatever we ascribe to the market's rally in recent days, the move up appears to be over for the time being. There is a strong argument that the second and third legs of the October rally in the S&P 500 has, in actuality, traced out the first half of a head and shoulders top, the breakdown from which is likely to represent a test of the October 10th (and, by extension, the July 24th) lows. |

|
| Figure 1: A look at the complex head and shoulders top in the S&P 500’s 60-minute chart. |
| Graphic provided by: TradeStation. |
| |
| The head and shoulders top I am suggesting is of the complex variety, which means--in this case, at least--that the pattern features more than one shoulder on each side of the head. Most other characteristics of the standard head and shoulders top formation still apply, such as proportionality between the left and right side shoulders, the generally downward trend in volume over the duration of the pattern, and the three clearly defined left shoulder-head-right shoulder sequence. In this case, the "second leg" of the S&P 500's October rally mentioned in the first paragraph represents a three-humped, left shoulder and the "third leg" of the rally represents the left half of the chart pattern's head. This all suggests that the pattern is a little over halfway from completion. The decline that began on November 7th has already traced out the right side of the head; what remains to be seen is whether or not the rest of the pattern will reveal itself over the next seven or eight trading days. |
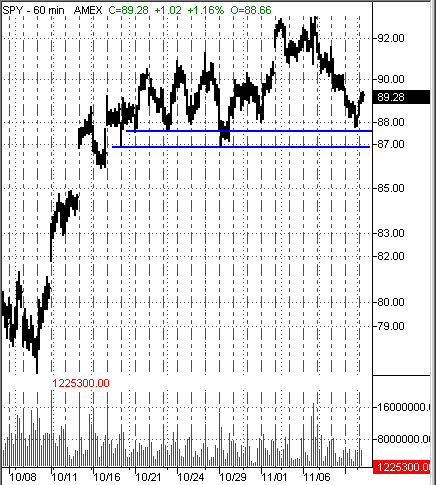
 Figure 2: Looking at the SPDRs chart of the S&P 500, volume declines from October 16th to November 1st before spiking as prices peak in what appears to be the formation's "head." Proportionality suggests that this "next seven or eight days" of trading should consist largely of choppy oscillation more or less between the same 867-903 range that characterized the left shoulder. Should this complex head and shoulders top be realized, then its peak to neckline 58-point range anticipates a decline to about 809. Given that this would be considered a minimum price move, it will still be worth watching to see if the S&P 500 continues to drop the additional 40-odd points to represent a true test of the July/October lows. |
| Many times technical analysts are encouraged to look at longer time frames in order to put current price action into context. If you usually look at daily charts, goes the logic, then it behooves you to take a look at a weekly view, as well. If you are an investor who tends to chart on a weekly basis, then consider a monthly chart as a way of analyzing trends that may support (or counter) your investment positions. This is all excellent advice. But it is equally true that looking at shorter time frames can help inform trading and investing decisions geared toward taking advantage of longer time frames, as well. |
Technical Writer for Technical Analysis of STOCKS & COMMODITIES magazine, Working-Money.com, and Traders.com Advantage.
| Title: | Technical Writer |
| Company: | Technical Analysis, Inc. |
| Address: | 4757 California Avenue SW |
| Seattle, WA 98116 | |
| Phone # for sales: | 206 938 0570 |
| Fax: | 206 938 1307 |
| Website: | www.Traders.com |
| E-mail address: | DPenn@traders.com |
Traders' Resource Links | |
| Charting the Stock Market: The Wyckoff Method -- Books | |
| Working-Money.com -- Online Trading Services | |
| Traders.com Advantage -- Online Trading Services | |
| Technical Analysis of Stocks & Commodities -- Publications and Newsletters | |
| Working Money, at Working-Money.com -- Publications and Newsletters | |
| Traders.com Advantage -- Publications and Newsletters | |
| Professional Traders Starter Kit -- Software | |
Click here for more information about our publications!
Comments
Date: 11/13/02Rank: 4Comment: Referral to shorter time frames in the last paragraph is the key.
Thanks.
Date: 11/16/02Rank: 3Comment:

|

Request Information From Our Sponsors
- StockCharts.com, Inc.
- Candle Patterns
- Candlestick Charting Explained
- Intermarket Technical Analysis
- John Murphy on Chart Analysis
- John Murphy's Chart Pattern Recognition
- John Murphy's Market Message
- MurphyExplainsMarketAnalysis-Intermarket Analysis
- MurphyExplainsMarketAnalysis-Visual Analysis
- StockCharts.com
- Technical Analysis of the Financial Markets
- The Visual Investor
- VectorVest, Inc.
- Executive Premier Workshop
- One-Day Options Course
- OptionsPro
- Retirement Income Workshop
- Sure-Fire Trading Systems (VectorVest, Inc.)
- Trading as a Business Workshop
- VectorVest 7 EOD
- VectorVest 7 RealTime/IntraDay
- VectorVest AutoTester
- VectorVest Educational Services
- VectorVest OnLine
- VectorVest Options Analyzer
- VectorVest ProGraphics v6.0
- VectorVest ProTrader 7
- VectorVest RealTime Derby Tool
- VectorVest Simulator
- VectorVest Variator
- VectorVest Watchdog
