HOT TOPICS LIST
- MACD
- Fibonacci
- RSI
- Gann
- ADXR
- Stochastics
- Volume
- Triangles
- Futures
- Cycles
- Volatility
- ZIGZAG
- MESA
- Retracement
- Aroon
INDICATORS LIST
LIST OF TOPICS
PRINT THIS ARTICLE
by Koos van der Merwe
There are certain patterns that have always been a good bet. Flags are one of them.
Position: Buy
Koos van der Merwe
Has been a technical analyst since 1969, and has worked as a futures and options trader with First Financial Futures in Johannesburg, South Africa.
PRINT THIS ARTICLE
ELLIOTT WAVE
A Flag For Darden Restaurants
04/29/15 02:47:01 PMby Koos van der Merwe
There are certain patterns that have always been a good bet. Flags are one of them.
Position: Buy
| The Darden family of restaurants features some of the most successful brands in dining. They boast Olive Garden, Longhorn Steakhouse, Bahama Breeze, Seasons52, The Capital Grille, Eddie V's, and Yard House. Through subsidies the company owns and operates more than 1,500 restaurants. On March 20, 2015 Darden Restaurants, Inc. (DRI) reported strong third quarter results and increased their earnings outlook for the year ahead. The company also maintained a regular quarterly dividend. |

|
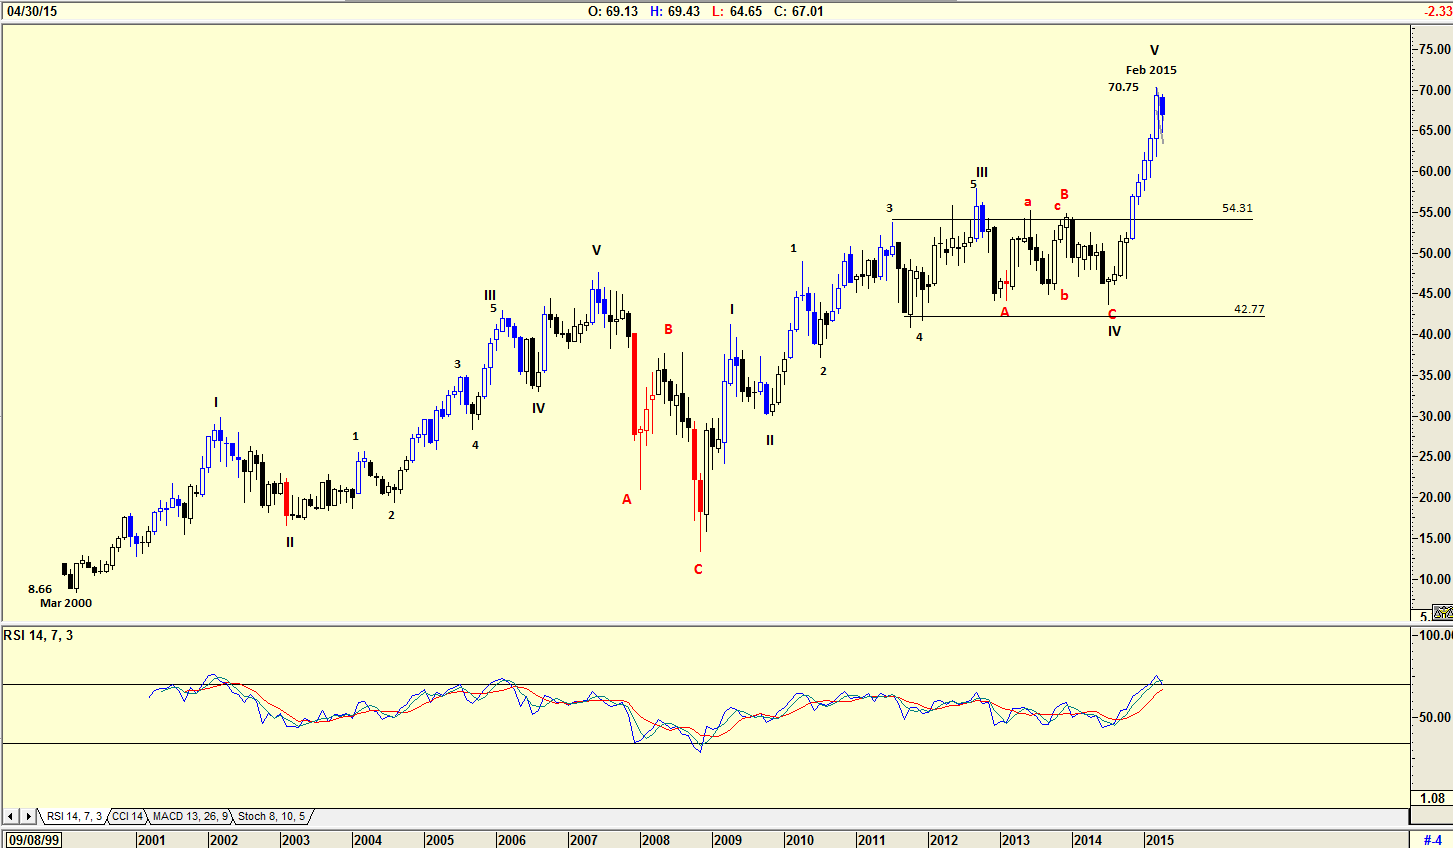
| Figure 1. Monthly Chart With Elliott Wave Count. The stock price of Darden Restaurants Inc. (DRI) rose from a low of $8.66 in March 2000 to a high of $70.75 by February 2015. The Elliott wave count is suggesting that price has completed a WAVE V. |
| Graphic provided by: AdvancedGET. |
| |
| The chart in Figure 1 is a monthly chart of the DRI stock price that shows how the price rose from a low of $8.66 in March 2000 to a high of $70.75 by February 2015. The Elliott wave count on the chart is suggesting that at $70.75, the share price has completed a WAVE V, and is due for a correction. This is confirmed by the relative strength indicator (RSI) which is at overbought levels. The correction will be to the 4th wave of lesser degree, which means that the share price should fall to somewhere between $42.77 and $54.31. |

|
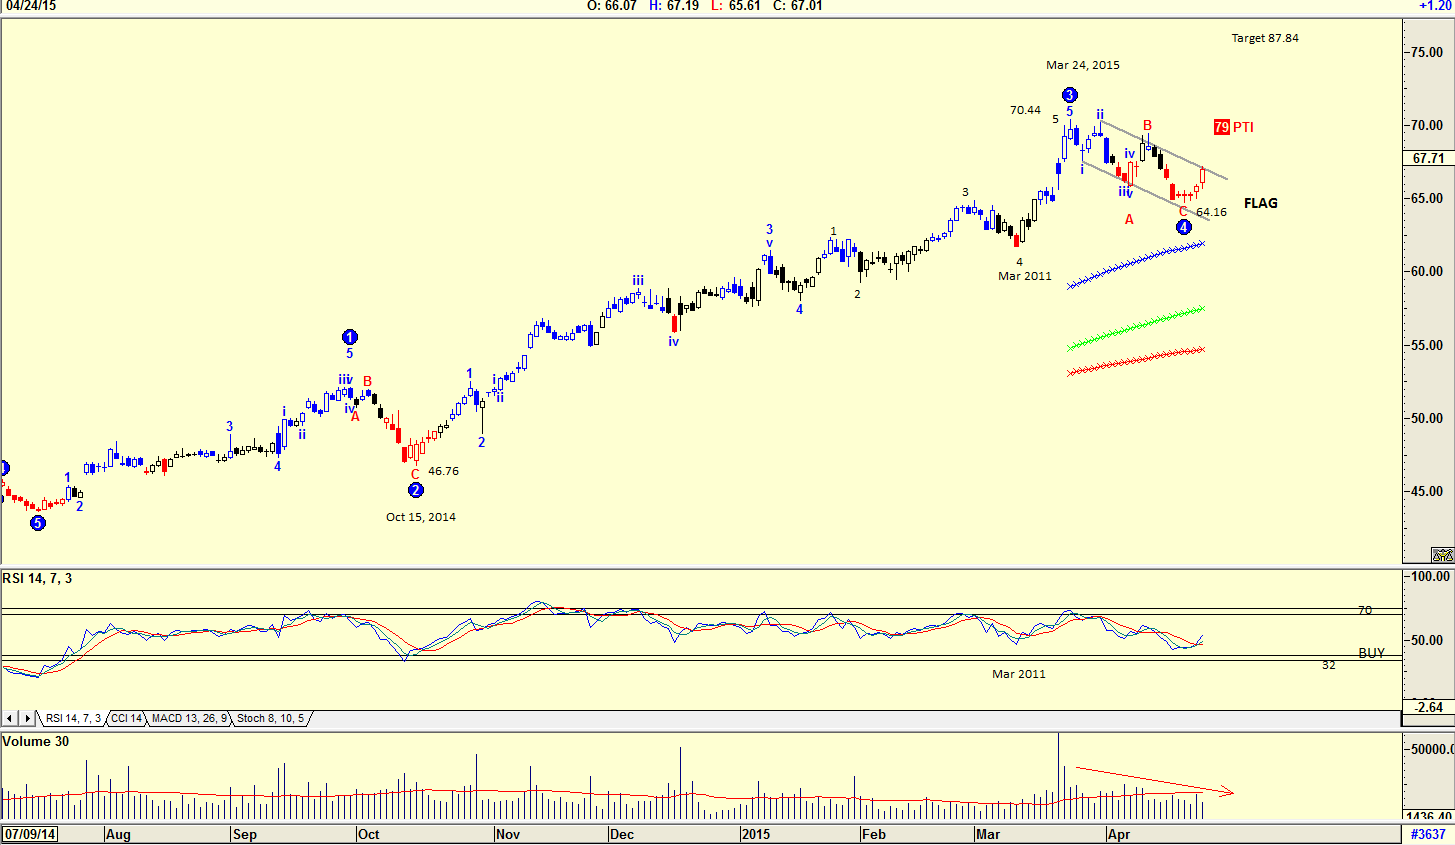
| Figure 2. Daily Chart Displaying A Flag Pattern. The occurrence of the flag pattern and the Elliott waves suggest that the share price could rise further. |
| Graphic provided by: AdvancedGET. |
| |
| The chart in Figure 2 is a daily chart with an Elliott wave count suggesting that the share price could rise higher. A flag pattern is a consolidation pattern, and is a reliable indicator in terms of direction and measuring. In a rising market, flags form after a dynamic, nearly straight move up on heavy volume. The target suggested by the pattern is $87.84. (70.44-46.76=23.68+64.16=87.84). The RSI, however, has not reached oversold levels and given a buy; although when you look back at the RSI, you can see that the share price rose strongly from March 2011 without the RSI reaching buy levels. As the flag formed, volume rose and fell, but did appear to weaken as the price fell, suggesting strength. |

|
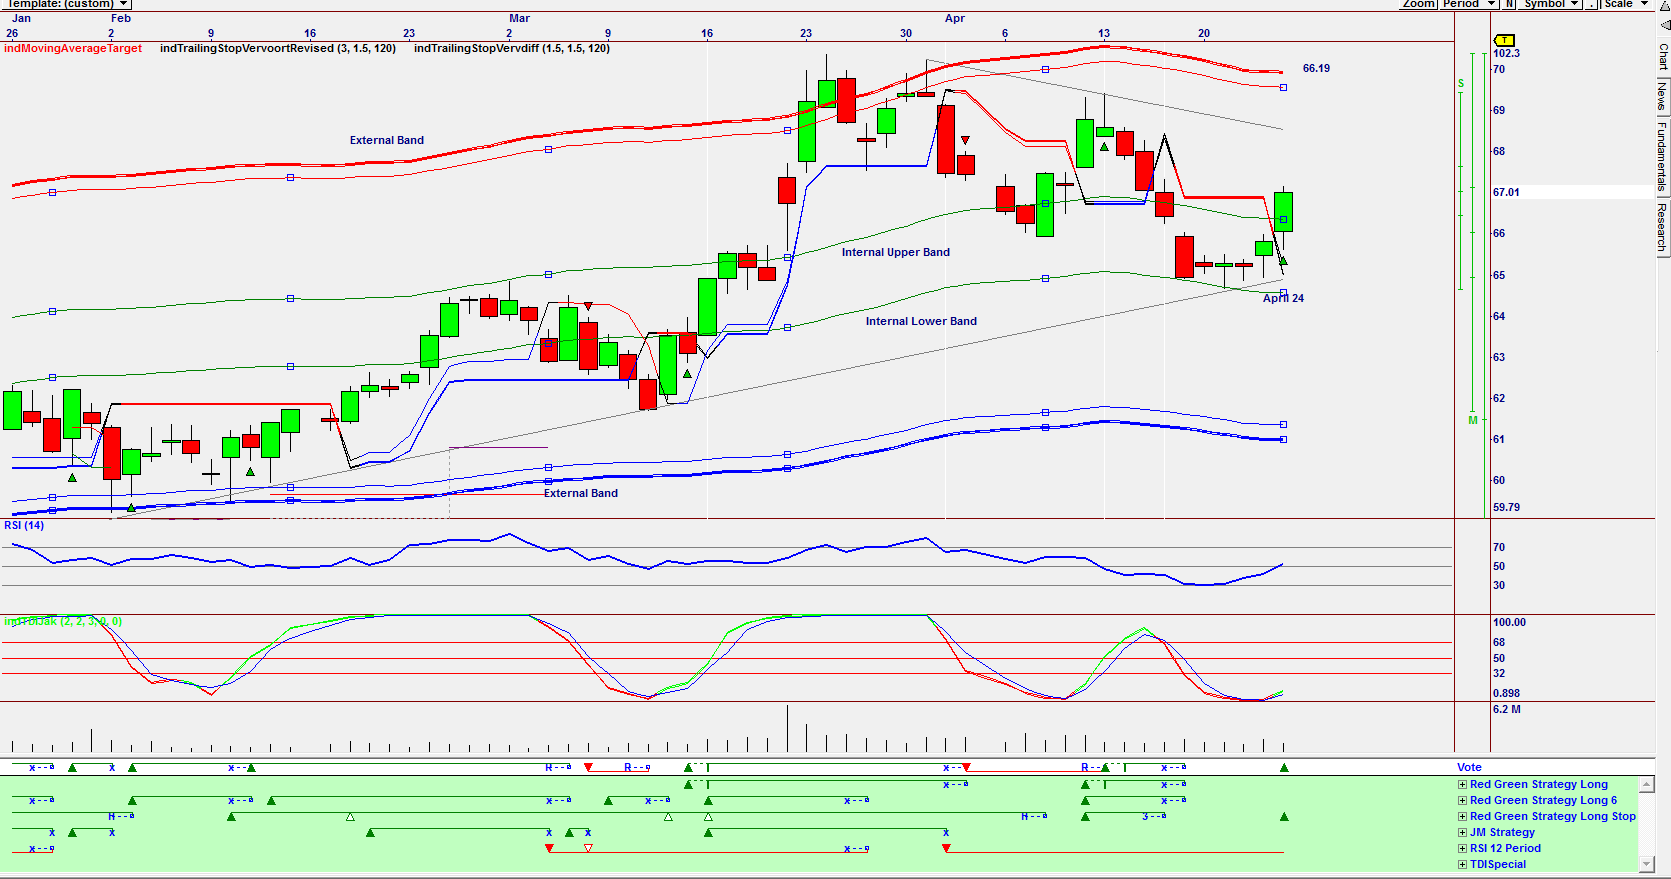
| Figure 3. Daily Chart Displaying A Buy Signal Given On The Vote Line. Price should rise and possibly find resistance at $66.19, a price suggested by the upper external band. Should the band start rising, so will the price. |
| Graphic provided by: Omnitrader. |
| |
| The chart in Figure 3 is an Omnitrader chart that triggered a buy signal on April 24, 2015 based on the Red Green strategy Long Stop shown in green below the Vote line. The RSI(15) shown on the chart is trending up as is the TDISpecial indicator which suggested a buy. Note how the share price corrected when it reached the upper external band and how it found support on the lower internal band. The price should rise and possibly find resistance at $66.19, a price suggested by the upper external band. Should the band start rising however, so will the price. I would be a buyer of Darden Restaurants at the present price with a target of $87.84 as suggested by the flag pattern shown in Figure 2. However with the resistance suggested by the upper band shown in Figure 3, I would keep my stops close. |
Has been a technical analyst since 1969, and has worked as a futures and options trader with First Financial Futures in Johannesburg, South Africa.
| Address: | 3256 West 24th Ave |
| Vancouver, BC | |
| Phone # for sales: | 6042634214 |
| E-mail address: | petroosp@gmail.com |
Click here for more information about our publications!
PRINT THIS ARTICLE

Request Information From Our Sponsors
- StockCharts.com, Inc.
- Candle Patterns
- Candlestick Charting Explained
- Intermarket Technical Analysis
- John Murphy on Chart Analysis
- John Murphy's Chart Pattern Recognition
- John Murphy's Market Message
- MurphyExplainsMarketAnalysis-Intermarket Analysis
- MurphyExplainsMarketAnalysis-Visual Analysis
- StockCharts.com
- Technical Analysis of the Financial Markets
- The Visual Investor
- VectorVest, Inc.
- Executive Premier Workshop
- One-Day Options Course
- OptionsPro
- Retirement Income Workshop
- Sure-Fire Trading Systems (VectorVest, Inc.)
- Trading as a Business Workshop
- VectorVest 7 EOD
- VectorVest 7 RealTime/IntraDay
- VectorVest AutoTester
- VectorVest Educational Services
- VectorVest OnLine
- VectorVest Options Analyzer
- VectorVest ProGraphics v6.0
- VectorVest ProTrader 7
- VectorVest RealTime Derby Tool
- VectorVest Simulator
- VectorVest Variator
- VectorVest Watchdog
