

HOT TOPICS LIST
- MACD
- Fibonacci
- RSI
- Gann
- ADXR
- Stochastics
- Volume
- Triangles
- Futures
- Cycles
- Volatility
- ZIGZAG
- MESA
- Retracement
- Aroon
INDICATORS LIST
LIST OF TOPICS
PRINT THIS ARTICLE
by Donald W. Pendergast, Jr.
Shares of Southwest Airlines are up five-fold in only 30 months; cracks are now appearing in this epic bull run, however.
Position: N/A
Donald W. Pendergast, Jr.
Freelance financial markets writer and online publisher of the Trendzetterz.com S&P 500 Weekly Forecast service.
PRINT THIS ARTICLE
CYCLES
LUV: Nosebleed Altitude?
04/24/15 04:16:36 PMby Donald W. Pendergast, Jr.
Shares of Southwest Airlines are up five-fold in only 30 months; cracks are now appearing in this epic bull run, however.
Position: N/A
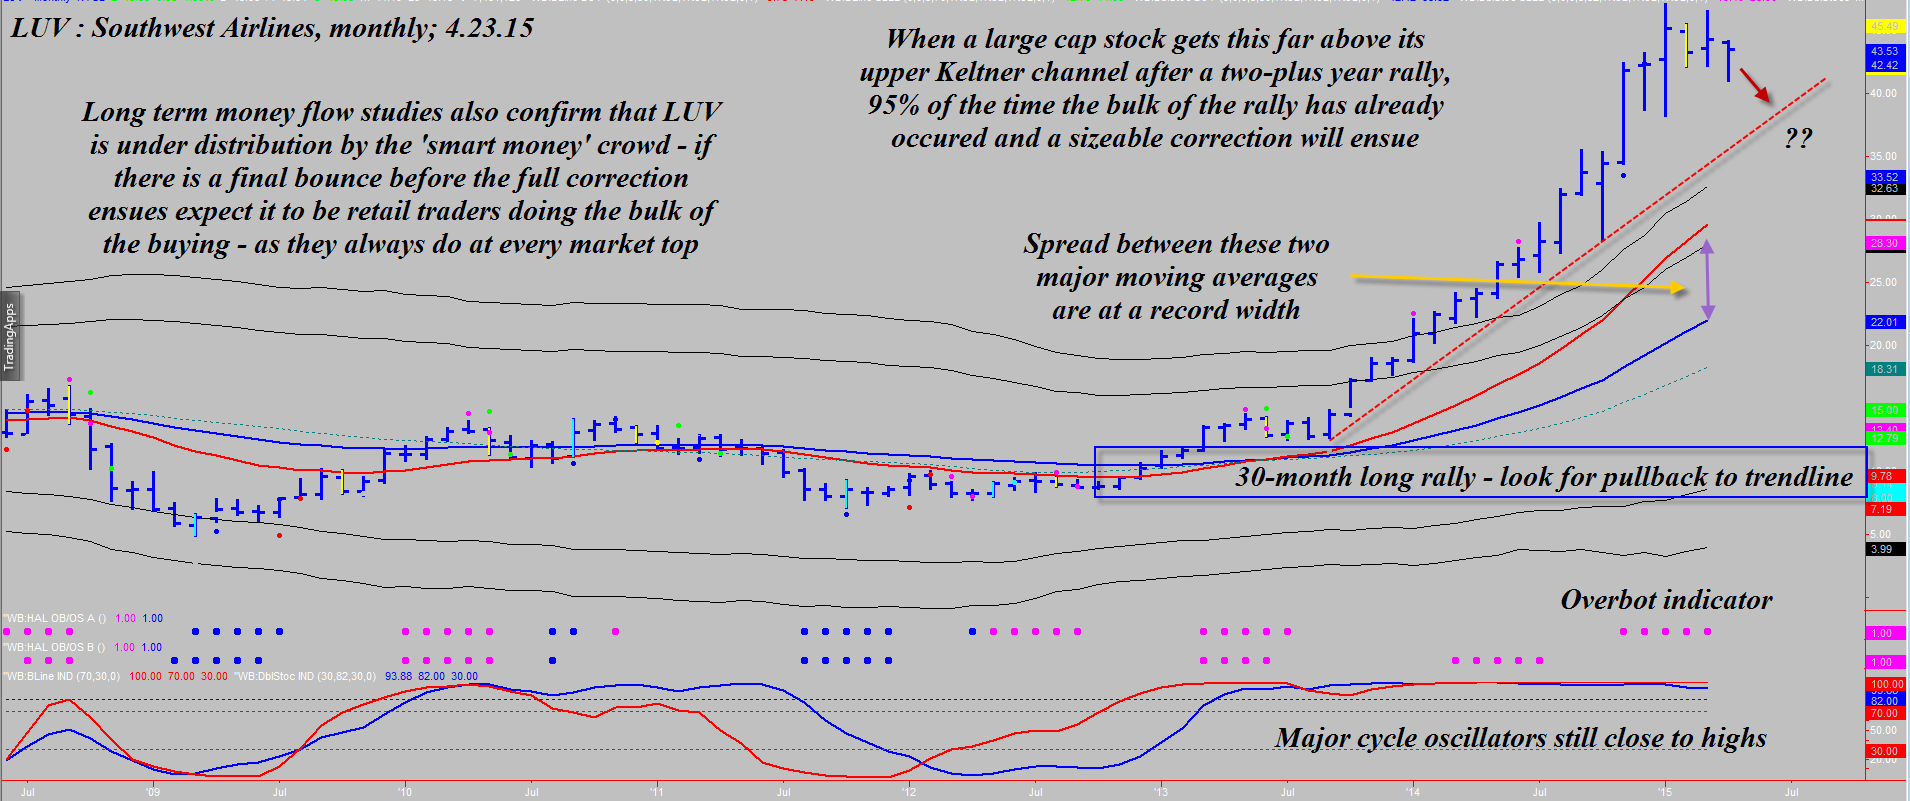
| The latest multiyear rally in shares of Southwest Airlines (LUV) launched in October 2012; from its low in the mid-$8 range in late October 2012 it proceeded to soar to as high as $47.17 by January 2015 for a better than 450% gain. The company's earnings growth has been helped over the past year by the tremendous discounting of oil prices, and that has also helped fuel the rally, pardon the pun. But now, severe cracks are evident in this literal high-flier's shares; here's a closer look now. |
|
| Figure 1. Monthly Chart Of Southwest Airlines (LUV). The stock of LUV rallied by 450% between October 2012 and January 2015, getting massively overextended above key statistical volatility norms. Look for lower prices ahead. |
| Graphic provided by: TradeStation. |
| Graphic provided by: ProfitTrader7 from www.walterbressert.com. |
| |
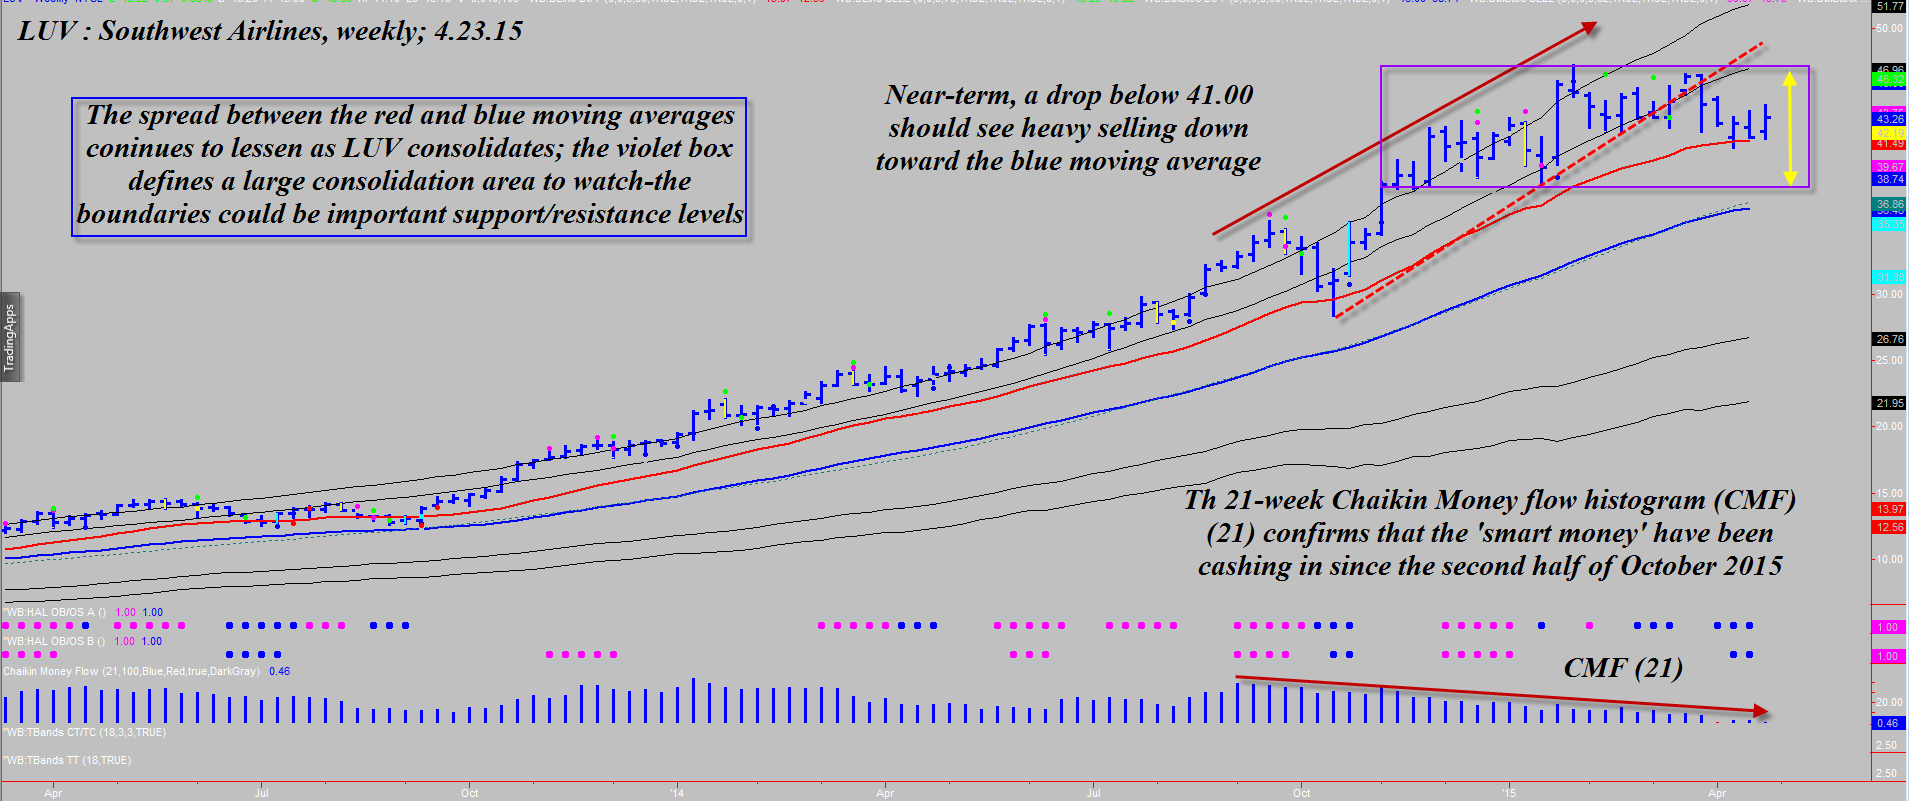
| As you look at LUV's monthly chart in Figure 1, note just how far it is trading above its extreme upper Keltner band; stocks simply do not spend a lot of time trading at such above-norm statistical volatility ranges — although there are exceptions from time to time — and once the last retail trader has bought at the top, the resulting plunges are often a wonder to behold. Here are the essentials for LUV at the moment: 1. As mentioned, LUV is trading at never-before-seen distances above its uppermost Keltner band. 2. The spread between the two major moving averages (red and blue) is also at a record width. 3. Weekly money flows, as seen in Figure 2, show a clear long-term distribution trend by the "smart money" — they progressively sell more of their shares into each new rally phase until they are almost flat by the time the last retail trader buys the stock based on a hot tip or a puff piece by some financial analyst for a big brokerage house. 4. The magenta dots on the monthly chart work extremely well with the Keltner bands to identify rallies and selloff that have gone too far, too fast. In this case, the Keltner bands and the overbought dots are in perfect agreement that a correction or pause is due. 5. At the very top end of a major multiyear rally like this, the fundamentals will almost always be uber-bullish; again, that's what causes the final rush of retail buyers to pile in, even as the smart money has packed up shop and headed for the train station. Anyone still long LUV from significantly lower price levels should be actively protecting their positions with put options and/or wisely placed trailing stops; for example if you got in early at $18 per share but still believe more upside is possible but you want to have a wide trailing stop, why not simply use the red long-term trend line as your make or break point? Traders who are more conservative might decide to use the lowest low of the past three months as their trailing stop; in this case the current low for April 2015 is the lowest of February, March and April ($41.05) and if you see that broken during May 2015 you know that's a good time to take gains and go back to cash. |
|
| Figure 2. Weekly Chart Of LUV. The weekly chart shows that prices are already in consolidation mode; a drop back beneath $41.00 sets up a low risk short, down toward the $38.00 level. |
| Graphic provided by: TradeStation. |
| Graphic provided by: ProfitTrader7 from www.walterbressert.com. |
| |
| The $41.00 level is a very important near-term support for LUV, and if you see that price taken out, going short toward the $38.00-$39.00 area looks like a no-brainer. Keep your risk levels modest and remember to trade wisely until we meet here again. |
Freelance financial markets writer and online publisher of the Trendzetterz.com S&P 500 Weekly Forecast service.
| Title: | Market consultant and writer |
| Company: | Trendzetterz |
| Address: | 81 Hickory Hollow Drive |
| Crossville, TN 38555 | |
| Phone # for sales: | 904-303-4814 |
| Website: | trendzetterz.com |
| E-mail address: | support@trendzetterz.com |
Traders' Resource Links | |
| Trendzetterz has not added any product or service information to TRADERS' RESOURCE. | |
Click here for more information about our publications!
PRINT THIS ARTICLE

Request Information From Our Sponsors
- VectorVest, Inc.
- Executive Premier Workshop
- One-Day Options Course
- OptionsPro
- Retirement Income Workshop
- Sure-Fire Trading Systems (VectorVest, Inc.)
- Trading as a Business Workshop
- VectorVest 7 EOD
- VectorVest 7 RealTime/IntraDay
- VectorVest AutoTester
- VectorVest Educational Services
- VectorVest OnLine
- VectorVest Options Analyzer
- VectorVest ProGraphics v6.0
- VectorVest ProTrader 7
- VectorVest RealTime Derby Tool
- VectorVest Simulator
- VectorVest Variator
- VectorVest Watchdog
- StockCharts.com, Inc.
- Candle Patterns
- Candlestick Charting Explained
- Intermarket Technical Analysis
- John Murphy on Chart Analysis
- John Murphy's Chart Pattern Recognition
- John Murphy's Market Message
- MurphyExplainsMarketAnalysis-Intermarket Analysis
- MurphyExplainsMarketAnalysis-Visual Analysis
- StockCharts.com
- Technical Analysis of the Financial Markets
- The Visual Investor