HOT TOPICS LIST
- MACD
- Fibonacci
- RSI
- Gann
- ADXR
- Stochastics
- Volume
- Triangles
- Futures
- Cycles
- Volatility
- ZIGZAG
- MESA
- Retracement
- Aroon
INDICATORS LIST
LIST OF TOPICS
PRINT THIS ARTICLE
by Chaitali Mohile
The waiting period may just have ended for the stock of Hon Industries.
Position: Hold
Chaitali Mohile
Active trader in the Indian stock markets since 2003 and a full-time writer. Trading is largely based upon technical analysis.
PRINT THIS ARTICLE
TECHNICAL ANALYSIS
HNI - Stock To Add To Your List
04/28/15 04:07:15 PMby Chaitali Mohile
The waiting period may just have ended for the stock of Hon Industries.
Position: Hold
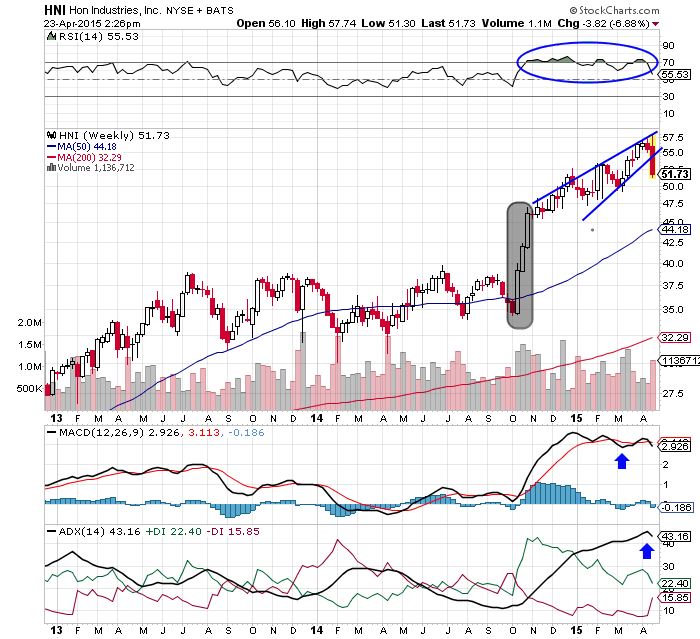
| The jittery trend of Hon Industries, Inc (HNI) reversed to a strong bullish trend in late 2014. On the weekly chart of HNI in Figure 1, you can see the three white big candlesticks that formed (shaded grey area). This is a robust bullish formation known as "three white soldiers." Each candle forms a new high and the next candle opens near the previous high. HNI hit three new tops in three consecutive weeks. The shaky trend indicator, the average directional index (ADX)(14), climbed above the 20 levels with power-packed buying pressure. The stock finally offered a low risk trading opportunity to potential buyers. |
| Although the relative strength index (RSI)(14) was rallying with the support of the center line, the bullish candlestick formation pulled the indicator in the confirmed bullish area. The moving average convergence/divergence (MACD)(12,26,9) also turned positive above the zero line. These healthy movements of the indicators strengthened the buyer's sentiments and their hold on the long trade. Later, HNI steadily surged, forming higher highs and marginally dropped at some levels. Gradually, the rally moved in a narrow range, forming a rising wedge — a bearish reversal pattern. As the indicators moved in their extreme areas, the price rally slowed down. Currently, the uptrend is overheated at 45 levels and the MACD has turned shaky in positive territory. In addition, the highly overbought RSI is showing a marginal negative divergence. These indicators confirmed the rising wedge formation, and therefore, highlight the possibility of a technical correction in HNI. The downward breakout of the wedge would not harm the bullishness of the stock. |

|
| Figure 1. Weekly Chart Of Hon Industries (HNI). The rising wedge is ready for a downward break. |
| Graphic provided by: StockCharts.com. |
| |
| Since it is an intermediate technical correction, HNI would open new buying opportunities for the traders waiting on the sideline. Traders can trigger long positions once the downward rally halts and is confirmed by the indicators. While initializing the new trades, traders should closely watch the price as well as indicator movement. Those already holding long positions can add to their positions with an appropriate stop-loss. The downward movement of the indicators and price would create room for a future rally. Therefore, opening a trade at this point would be low risk. |
| The current rising wedge breakout is also a quick short trading opportunity. The 50-day moving average support would be the estimated target for this short trade. However, various support levels like $50 and $47 should also be observed carefully. To remind you, this short position cannot be carried forward for a long period. |

|
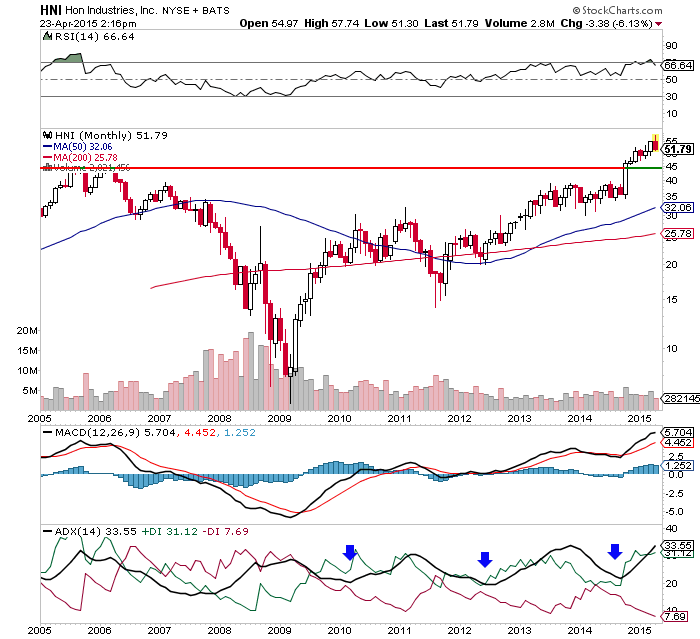
| Figure 2. Monthly Chart Of Hon Industries (HNI). The support level for any downward price rally is at $45. |
| Graphic provided by: StockCharts.com. |
| |
| The monthly chart in Figure 2 shows the strongest support levels of HNI. The support-resistance line on the price chart shows $45 as an ultimate support for any downside rally. The uptrend is well positioned to stabilize the rally above the support line. The RSI and the MACD are comfortable in their bullish areas. HNI is a healthy bullish stock that deserves to be ranked highly on your trading list. |
Active trader in the Indian stock markets since 2003 and a full-time writer. Trading is largely based upon technical analysis.
| Company: | Independent |
| Address: | C1/3 Parth Indraprasth Towers. Vastrapur |
| Ahmedabad, Guj 380015 | |
| E-mail address: | chaitalimohile@yahoo.co.in |
Traders' Resource Links | |
| Independent has not added any product or service information to TRADERS' RESOURCE. | |
Click here for more information about our publications!
PRINT THIS ARTICLE

Request Information From Our Sponsors
- StockCharts.com, Inc.
- Candle Patterns
- Candlestick Charting Explained
- Intermarket Technical Analysis
- John Murphy on Chart Analysis
- John Murphy's Chart Pattern Recognition
- John Murphy's Market Message
- MurphyExplainsMarketAnalysis-Intermarket Analysis
- MurphyExplainsMarketAnalysis-Visual Analysis
- StockCharts.com
- Technical Analysis of the Financial Markets
- The Visual Investor
- VectorVest, Inc.
- Executive Premier Workshop
- One-Day Options Course
- OptionsPro
- Retirement Income Workshop
- Sure-Fire Trading Systems (VectorVest, Inc.)
- Trading as a Business Workshop
- VectorVest 7 EOD
- VectorVest 7 RealTime/IntraDay
- VectorVest AutoTester
- VectorVest Educational Services
- VectorVest OnLine
- VectorVest Options Analyzer
- VectorVest ProGraphics v6.0
- VectorVest ProTrader 7
- VectorVest RealTime Derby Tool
- VectorVest Simulator
- VectorVest Variator
- VectorVest Watchdog
