HOT TOPICS LIST
- MACD
- Fibonacci
- RSI
- Gann
- ADXR
- Stochastics
- Volume
- Triangles
- Futures
- Cycles
- Volatility
- ZIGZAG
- MESA
- Retracement
- Aroon
INDICATORS LIST
LIST OF TOPICS
PRINT THIS ARTICLE
by Koos van der Merwe
The price of Intel Corp. rose from 88 cents in October 1990 to a high of $75.81 by August 2000. Then came the crash.
Position: Sell
Koos van der Merwe
Has been a technical analyst since 1969, and has worked as a futures and options trader with First Financial Futures in Johannesburg, South Africa.
PRINT THIS ARTICLE
HEAD & SHOULDERS
A Look At Intel Corporation
04/23/15 03:56:09 PMby Koos van der Merwe
The price of Intel Corp. rose from 88 cents in October 1990 to a high of $75.81 by August 2000. Then came the crash.
Position: Sell
| Intel Corporation (INTC) is one of the world's largest semiconductor chip makers. Founded in 1968 in California, the company soon became one of the world's largest and highest valued semiconductor chip maker. The company also manufactures motherboard chipsets, network interface controllers and integrated circuits, flash memory graphic chips, and many other devices related to communications and computing. Intel became the dominant supplier of microprocessors for PCs, and became known for aggressive and sometimes illegal tactics in defense of its market position, particularly against Advanced Micro Devices (AMD). In the 2013 rankings of the world's 100 most valuable brands, the company's brand value was number 61. Investing in a solid company for the long-term is always an asset, so at the present price is it worth buying and holding INTC shares for the long-term? |

|
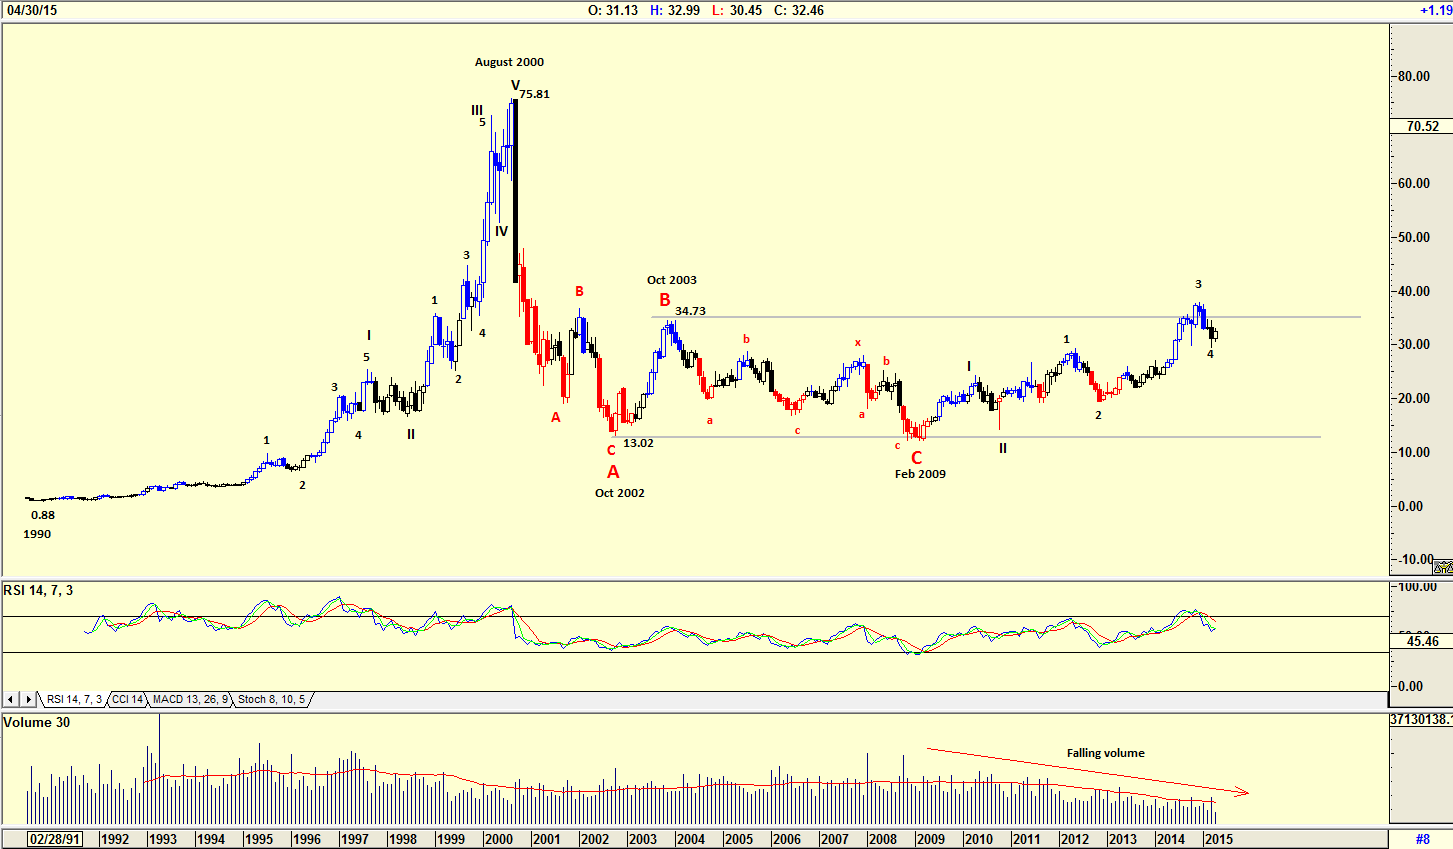
| Figure 1. Monthly Chart Of Intel Corp. (INTC). Here you see a head & shoulders pattern that formed on the price chart. |
| Graphic provided by: AdvancedGET. |
| |
| The chart in Figure 1 is a monthly chart showing how the stock price rose from a low of 88 cents in 1990 to a high of $75.81 by August 2000, and then fell, as the technology bubble burst, to a low of $13.02 by October 2002. The share price then rose to $34.73 in the year that followed, but slowly fell to the support line of $13.02, probably as increased competition started appearing throughout the world. The share price has since gradually risen to retest the $34.73 resistance line, but has started correcting in what could be an Elliott wave 4 in WAVE III. The relative strength index (RSI) is suggesting weakness, and the volume fell as the share price rose, a further sign of weakness. So, is it worth buying INTC at current levels? Earnings per share (EPS) is expected to increase during 2015 to an annual average rate of over $2.50 per year and, recently, five out of 11 top analysts have recently set the stock price target above $40. Speculation is that a likely bump in EPS will be caused by the sales of Skylake with the introduction of Windows 10. What do the daily charts suggest? |

|
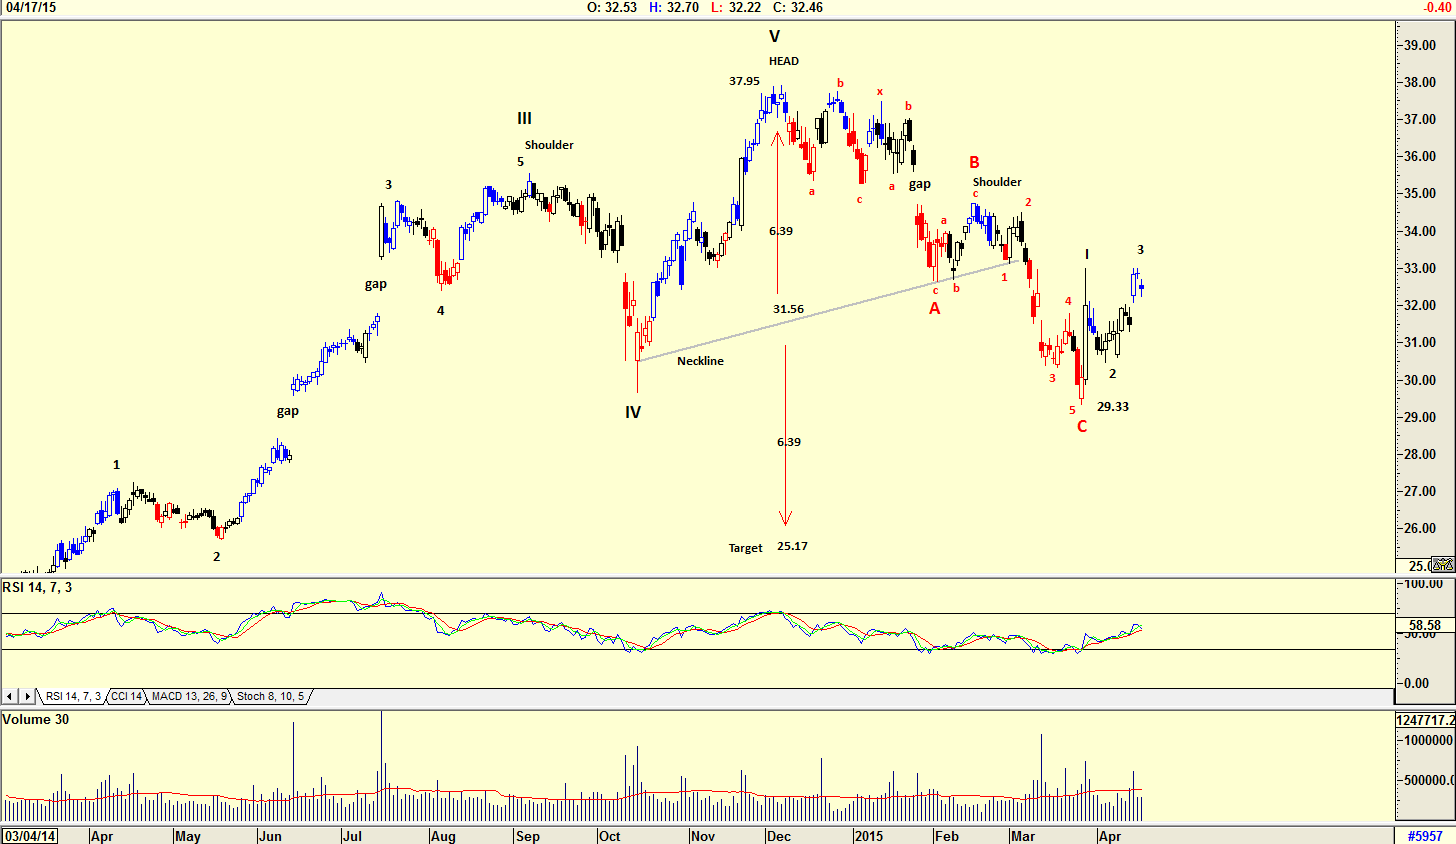
| Figure 2. Daily Chart With Elliott Wave Count. The stock price is likely in a Wave 3 with a Wave 4 correction sometime in the future. |
| Graphic provided by: AdvancedGET. |
| |
| The daily chart in Figure 2 shows that a head & shoulders pattern has formed, suggesting a target of $25.17 (37.95-31.56 = 6.39 and 31.56 - 6.39 = 25.17). The Elliott wave count however is suggesting that the share price is in a Wave 3 with a Wave 4 correction sometime in the future. The RSI suggests that the wave 3 has further to rise. You should never forget, though, that an Elliott wave count is simply a signpost in the wilderness, and that the next signpost is a little way down the road — a signpost that can change the wave count. That the share price appears to have bottomed at $29.33 and not the $25.71 as suggested by the head & shoulders pattern is a concern. Finally, note the gaps that formed on the chart and that in every instance the share price moved to fill the gap. |

|
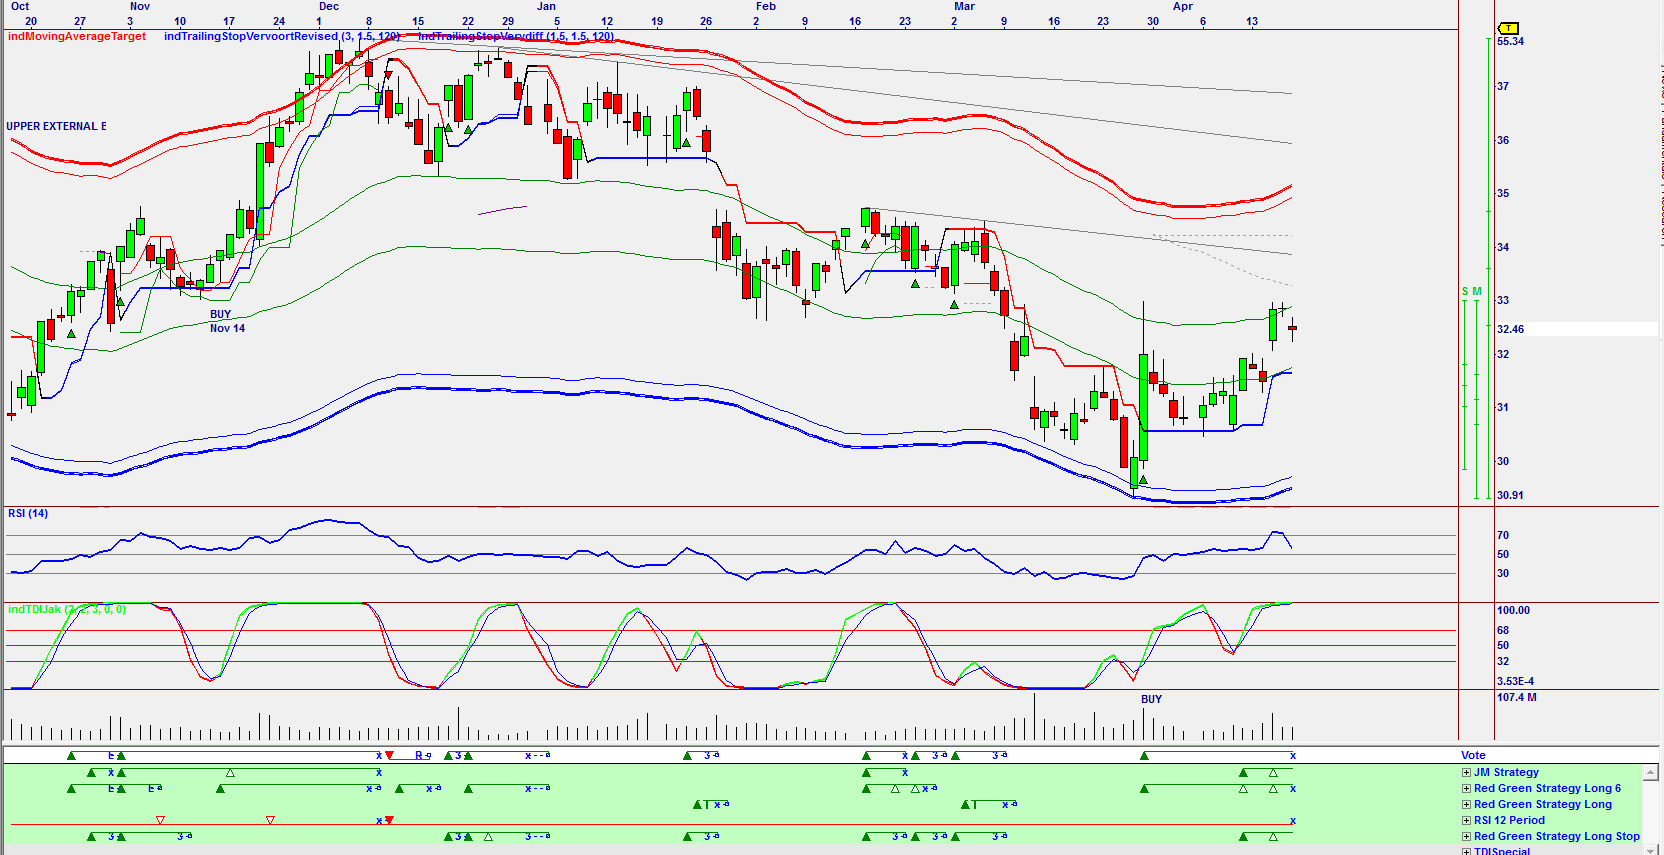
| Figure 3. Omnitrader Chart Showing The Stop. The RSI and TDIJak indicators are suggesting a sell signal. |
| Graphic provided by: Omnitrader. |
| |
| The chart in Figure 3 is an Omnitrader chart with the Vote line suggesting a stop signal after having given a buy on March 27, 2015 with the close at $32.00 based on the red/green strategies shown below the Vote line. Both RSI and the TDIjak indicators are suggesting a sell signal. I would not be a buyer of INTC even though the RSI is rising. I would prefer waiting for the correction to finalize. |
Has been a technical analyst since 1969, and has worked as a futures and options trader with First Financial Futures in Johannesburg, South Africa.
| Address: | 3256 West 24th Ave |
| Vancouver, BC | |
| Phone # for sales: | 6042634214 |
| E-mail address: | petroosp@gmail.com |
Click here for more information about our publications!
PRINT THIS ARTICLE

Request Information From Our Sponsors
- StockCharts.com, Inc.
- Candle Patterns
- Candlestick Charting Explained
- Intermarket Technical Analysis
- John Murphy on Chart Analysis
- John Murphy's Chart Pattern Recognition
- John Murphy's Market Message
- MurphyExplainsMarketAnalysis-Intermarket Analysis
- MurphyExplainsMarketAnalysis-Visual Analysis
- StockCharts.com
- Technical Analysis of the Financial Markets
- The Visual Investor
- VectorVest, Inc.
- Executive Premier Workshop
- One-Day Options Course
- OptionsPro
- Retirement Income Workshop
- Sure-Fire Trading Systems (VectorVest, Inc.)
- Trading as a Business Workshop
- VectorVest 7 EOD
- VectorVest 7 RealTime/IntraDay
- VectorVest AutoTester
- VectorVest Educational Services
- VectorVest OnLine
- VectorVest Options Analyzer
- VectorVest ProGraphics v6.0
- VectorVest ProTrader 7
- VectorVest RealTime Derby Tool
- VectorVest Simulator
- VectorVest Variator
- VectorVest Watchdog
