

HOT TOPICS LIST
- MACD
- Fibonacci
- RSI
- Gann
- ADXR
- Stochastics
- Volume
- Triangles
- Futures
- Cycles
- Volatility
- ZIGZAG
- MESA
- Retracement
- Aroon
INDICATORS LIST
LIST OF TOPICS
PRINT THIS ARTICLE
by Chaitali Mohile
Alcoa, Inc. has entered a new phase. Will it continue in this new direction or will it restart its previous journey?
Position: N/A
Chaitali Mohile
Active trader in the Indian stock markets since 2003 and a full-time writer. Trading is largely based upon technical analysis.
PRINT THIS ARTICLE
BREAKOUTS
Alcoa's New Journey
04/20/15 05:22:04 PMby Chaitali Mohile
Alcoa, Inc. has entered a new phase. Will it continue in this new direction or will it restart its previous journey?
Position: N/A
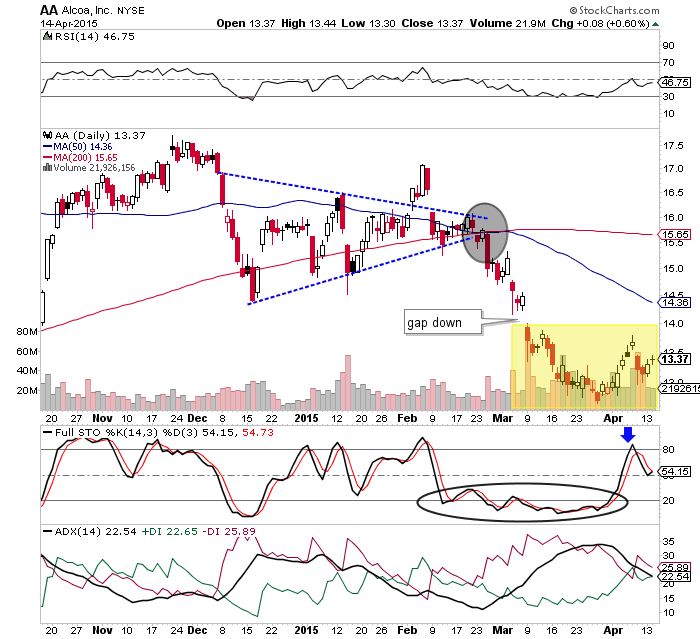
| A symmetrical triangle can breakout in any direction and that direction can only be determined after a confirmed breakout. The stock price of Alcoa, Inc. (AA) formed a symmetrical triangle on its daily chart (Figure 1). The upper and lower ends of the triangle were highly volatile. Note the convergence of the 200- and 50-day moving averages respectively. The price breakout point at $15 had bearish strength given that the stock price broke out below the support of the symmetrical triangle and the moving averages. Immediately after these breakouts, the 50-day MA plunged below the 200-day MA, highlighting a bearish moving average crossover. |
| During the symmetrical triangle formation, the stock moved in a downtrend with high volatility. The breakout point shows uncertainty in ADX(14) but the trend quickly resumed its track. AA slipped into a fresh zone, re-entering the downtrend as indicated by the average directional index (ADX)(14). The gap down strengthened the developing downtrend once again. Initially, price movement at the bottom (yellow shaded area) looked like a rounded bottom — a bullish reversal formation in Figure 1. Though an oversold full stochastic (14,3,3) and relative strength index (RSI)(14) showed reversal signals, they failed to climb and sustain in their bullish areas. As a result, AA continued moving to lower levels. |
|
| Figure 1: Daily Chart Of Alcoa Inc. (AA): The strong bearish sentiments have sent the RSI(14) and stochastic oscillator to below 50 levels. |
| Graphic provided by: StockCharts.com. |
| |
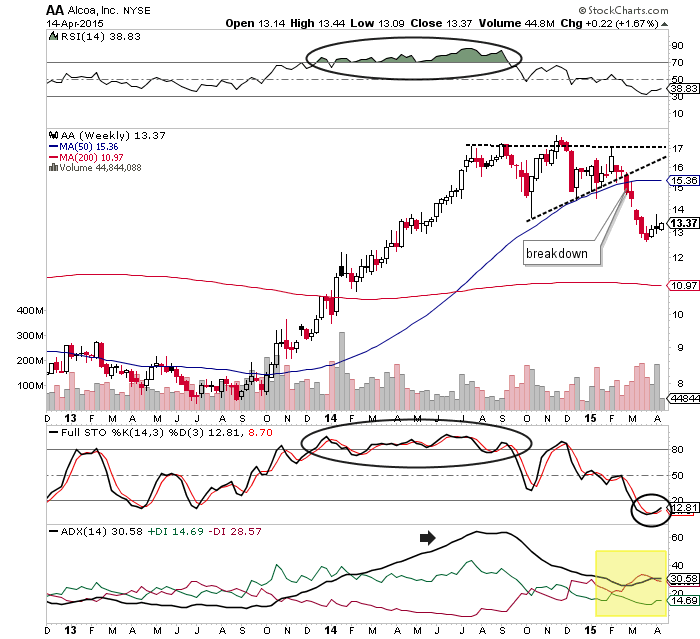
| AA was in a strong uptrend for more than a year. The weekly chart in Figure 2 shows a steady vertical rally in AA from $8 to $17. The stock rallied with high volume till it hit the top at $17 levels. The overbought indicators and overheated uptrend resulted in a reversal in the vertical rally to a sideways horizontal movement. Due to the trend reversal effect, the stock consolidated, forming a bullish flag & pennant formation in Figure 2. This bullish continuation pattern usually breaks in an upward direction, resuming the previous advance rally. However, in Figure 2, the pattern breached downward, suggesting a major pattern failure for AA, which is a strong reversal indication for any stock. |
|
| Figure 2: Weekly Chart of Alcoa Inc (AA): The 200-period MA is the ultimate support for the current bearish rally of AA. |
| Graphic provided by: StockCharts.com. |
| |
| During the breakout, AA plunged below the 50-period MA support. This price action dragged the stock into a downtrend. The stochastic oscillator is moving in an oversold region, suggesting more downside. The RSI(14) has slipped below the 50 levels, indicating more selling pressure in the breakout rally. Under these circumstances, AA would retrace toward the 200-period MA support, strengthening bearish sentiments. The 50-period MA resistance would discourage any relief rally in the near future until the indicators change direction. |
| Therefore, the bullish flag & pennant pattern failure could lead to major damage to AA. This new bearish journey would continue till the stock overcomes its resistances on various time frame charts. |
Active trader in the Indian stock markets since 2003 and a full-time writer. Trading is largely based upon technical analysis.
| Company: | Independent |
| Address: | C1/3 Parth Indraprasth Towers. Vastrapur |
| Ahmedabad, Guj 380015 | |
| E-mail address: | chaitalimohile@yahoo.co.in |
Traders' Resource Links | |
| Independent has not added any product or service information to TRADERS' RESOURCE. | |
Click here for more information about our publications!
PRINT THIS ARTICLE

Request Information From Our Sponsors
- StockCharts.com, Inc.
- Candle Patterns
- Candlestick Charting Explained
- Intermarket Technical Analysis
- John Murphy on Chart Analysis
- John Murphy's Chart Pattern Recognition
- John Murphy's Market Message
- MurphyExplainsMarketAnalysis-Intermarket Analysis
- MurphyExplainsMarketAnalysis-Visual Analysis
- StockCharts.com
- Technical Analysis of the Financial Markets
- The Visual Investor
- VectorVest, Inc.
- Executive Premier Workshop
- One-Day Options Course
- OptionsPro
- Retirement Income Workshop
- Sure-Fire Trading Systems (VectorVest, Inc.)
- Trading as a Business Workshop
- VectorVest 7 EOD
- VectorVest 7 RealTime/IntraDay
- VectorVest AutoTester
- VectorVest Educational Services
- VectorVest OnLine
- VectorVest Options Analyzer
- VectorVest ProGraphics v6.0
- VectorVest ProTrader 7
- VectorVest RealTime Derby Tool
- VectorVest Simulator
- VectorVest Variator
- VectorVest Watchdog