HOT TOPICS LIST
- MACD
- Fibonacci
- RSI
- Gann
- ADXR
- Stochastics
- Volume
- Triangles
- Futures
- Cycles
- Volatility
- ZIGZAG
- MESA
- Retracement
- Aroon
INDICATORS LIST
LIST OF TOPICS
PRINT THIS ARTICLE
by Koos van der Merwe
Microsoft has always reported good earnings and met their earnings whisper number, yet, before every earnings announcement, there has always been speculation that 'this time they will miss.' Now that their legal case with the government has been settled, how does the future look?
Position: Accumulate
Koos van der Merwe
Has been a technical analyst since 1969, and has worked as a futures and options trader with First Financial Futures in Johannesburg, South Africa.
PRINT THIS ARTICLE
HEAD & SHOULDERS
Cycles & Patterns: A Look at Microsoft
11/12/02 12:15:46 PMby Koos van der Merwe
Microsoft has always reported good earnings and met their earnings whisper number, yet, before every earnings announcement, there has always been speculation that 'this time they will miss.' Now that their legal case with the government has been settled, how does the future look?
Position: Accumulate
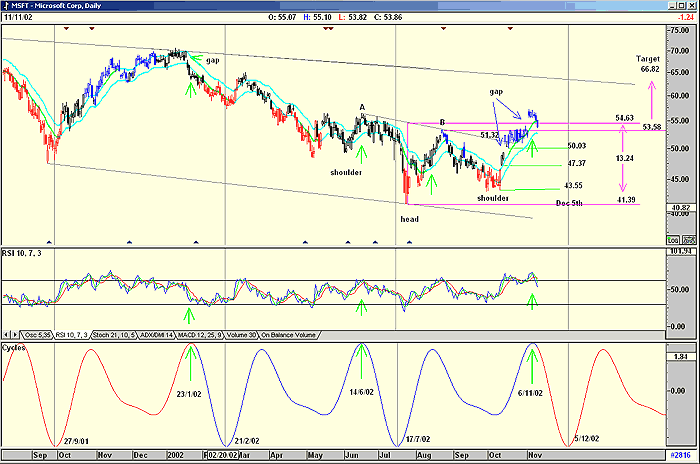
| To try and forecast Microsoft's future, I have looked to its past. In the chart, I have drawn lower and upper trendlines that are parallel to each other. This sets me an upper target price sometime in the future. I have also included an automated cycle analysis using Advanced GET, the program I use. I have observed that cycles tend to follow lows with far greater accuracy than they do tops and that cycle tops tend to come in earlier in a bear trend and later in a bull trend. In the cycle shown, the Sepetmeber 27, 2001 bottom was found with pretty good accuracy, as shown by both the price chart and the RSI indicator. Another bottom occured on February 21, 2002, but six days too early on July 17, 2002. This means that the expected low of December 5 is suspect, and could be six days earlier. |
| As to the highs in the cycle shown, I tend to get two highs. The first one I ignored as being too unreliable, but the second one could be useful. The high of January 23 was early, suggesting a down move, which happened with a gap. The second high, on June 14, 2002 was on schedule, as was the high on November 6, 2002. All the highs correlated with oversold positions on the RSI indicator with the exception of the first high on January 23, 2002. |

|
| Looking at Microsoft |
| Graphic provided by: AdvancedGET. |
| |
| Finally, Microsoft has completed an inverse head and shoulder formation, and has broken out above the neckline at 51.32. This gives me a target price that Microsoft should reach sometime in the future. The bottom of the head is 41.39. The neckline A-B at that point is 54.63, with the difference being 13.24. Add this to the neckline at B (I prefer to be conservative) and you get a target of 66.82. Now, look at the chart. First, Microsoft fell to 'fill the gap' as is expected when a gap occurs. By all accounts, the share price should soon start moving up, having completed its 'job.' However, cycles are telling me that a high has occurred, and the share price could fall to a cycle low on approximately December 5, or six days before that date. The RSI indicator has also given a sell signal, not yet confirmed by the JM band where the price has not broken below the lower blue band line, but it looks as though it will. |
| The next support level is 50.03, the upper boundary of the gap as shown on the chart. Others are 47.37 and 43.55. Any one of these support levels could coincide with the cycle bottom. Once this cycle low has been reached, I know from previous cycles that there is approximately a four month period before the next cycle high. This is not a certainty, because as I said earlier, cycle highs are not regular. Because the cycle was six days early in a falling market, should Microsoft be in a rising trend, the cycle will tend to lean towards a later date, so the high could be exactly at four months or a few days later. Finally, around that cycle high, the upper resistance line looks as though it could be closer to the 60 level than the 66.82 target level of the head and shoulders. Either way, this would be a nice profit of approximately 20 percent. |
| I now wait, and update my picture as Microsoft unfolds. Once the cycle bottom has been reached, if my indicators give the OK, it is time to buy the stock. |
Has been a technical analyst since 1969, and has worked as a futures and options trader with First Financial Futures in Johannesburg, South Africa.
| Address: | 3256 West 24th Ave |
| Vancouver, BC | |
| Phone # for sales: | 6042634214 |
| E-mail address: | petroosp@gmail.com |
Click here for more information about our publications!
PRINT THIS ARTICLE

Request Information From Our Sponsors
- StockCharts.com, Inc.
- Candle Patterns
- Candlestick Charting Explained
- Intermarket Technical Analysis
- John Murphy on Chart Analysis
- John Murphy's Chart Pattern Recognition
- John Murphy's Market Message
- MurphyExplainsMarketAnalysis-Intermarket Analysis
- MurphyExplainsMarketAnalysis-Visual Analysis
- StockCharts.com
- Technical Analysis of the Financial Markets
- The Visual Investor
- VectorVest, Inc.
- Executive Premier Workshop
- One-Day Options Course
- OptionsPro
- Retirement Income Workshop
- Sure-Fire Trading Systems (VectorVest, Inc.)
- Trading as a Business Workshop
- VectorVest 7 EOD
- VectorVest 7 RealTime/IntraDay
- VectorVest AutoTester
- VectorVest Educational Services
- VectorVest OnLine
- VectorVest Options Analyzer
- VectorVest ProGraphics v6.0
- VectorVest ProTrader 7
- VectorVest RealTime Derby Tool
- VectorVest Simulator
- VectorVest Variator
- VectorVest Watchdog
