HOT TOPICS LIST
- MACD
- Fibonacci
- RSI
- Gann
- ADXR
- Stochastics
- Volume
- Triangles
- Futures
- Cycles
- Volatility
- ZIGZAG
- MESA
- Retracement
- Aroon
INDICATORS LIST
LIST OF TOPICS
PRINT THIS ARTICLE
by Koos van der Merwe
On April 10, 2015 General Electric Co. announced that it planned to create a simpler more valuable industrial company by selling most of GE Capital Assets over the next 24 months.
Position: Accumulate
Koos van der Merwe
Has been a technical analyst since 1969, and has worked as a futures and options trader with First Financial Futures in Johannesburg, South Africa.
PRINT THIS ARTICLE
TECHNICAL ANALYSIS
A Look At General Electric
04/17/15 03:51:11 PMby Koos van der Merwe
On April 10, 2015 General Electric Co. announced that it planned to create a simpler more valuable industrial company by selling most of GE Capital Assets over the next 24 months.
Position: Accumulate
| General Electric Co. (GE), on April 10, 2015 announced that it planned to return more than $90 billion to shareholders by 2018. The press release detailed a grand plan for the future of the company. The only thing left for them to do is execute that plan. One major positive is an increased dividend growth to approximately 3.68%. Also, by selling GE Capital Assets to buy shares, the company is able to dispose off risky assets while simultaneously shrinking the float and returning capital to shareholders. |

|
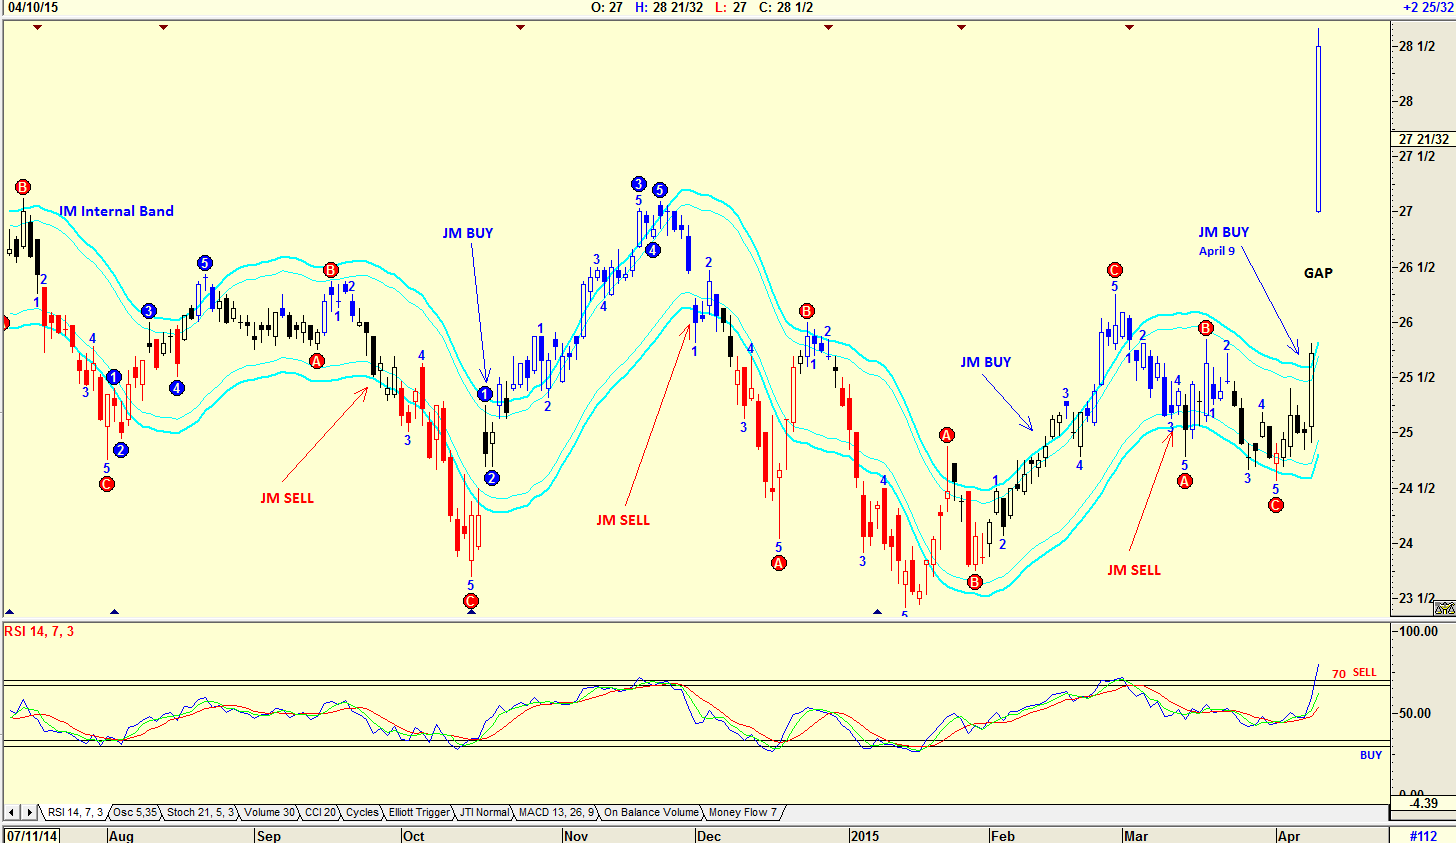
| Figure 1. Daily Chart Of General Electroc Co. (GE). The price of the stock jumped on a gap when the news was released. |
| Graphic provided by: AdvancedGET. |
| |
| The chart in Figure 1 is a daily chart that shows how the share price jumped on a gap when the news was released. The chart also shows a JM internal band buy signal given on April 9, 2015 the day before the announcement was made. Of course the question on everyone's mind is, was this an insider trading bounce? The relative strength index (RSI) is now at oversold levels, but has not given a sell signal. This will only happen when the RSI drops below the 70 horizontal line. Also note that the Elliott wave count has not suggested a wave count for the present move. Of course, the rule that a share will usually fall to fill a gap weighs on one's mind. |

|
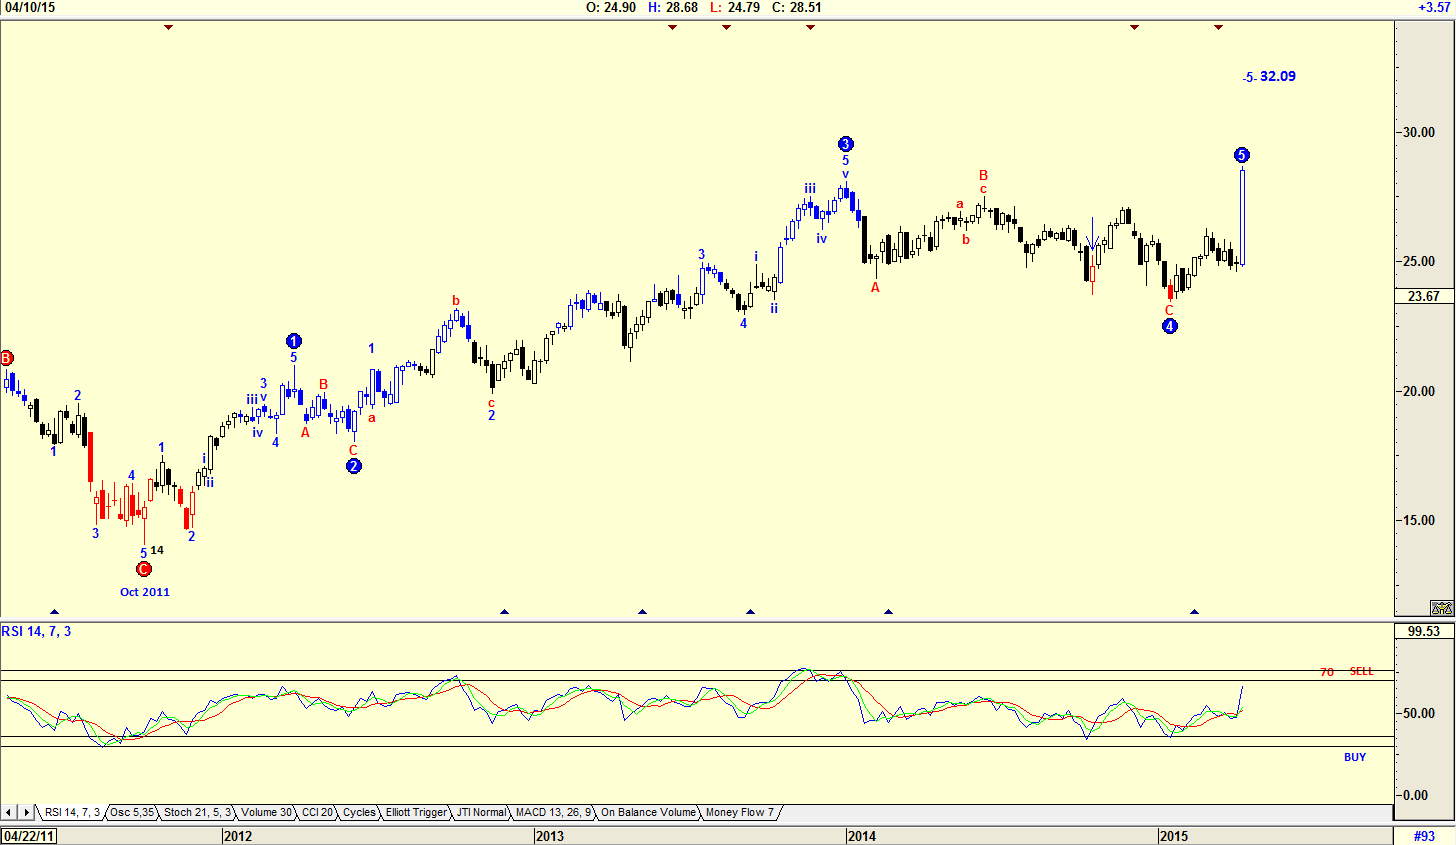
| Figure 2. Weekly Chart With Elliott Wave Count. The share price rose from a low of $14 on October 2011 to its current high of $28.51 with an Elliott wave count. |
| Graphic provided by: AdvancedGET. |
| |
| The chart in Figure 2 is a weekly chart showing how the share price has risen from a low of $14 on October 2011 to its current high of $28.51 with an Elliott wave count suggesting that the share price is tracing a WAVE 5. The Elliott wave count is suggesting a WAVE 5 target of $32.09. |

|
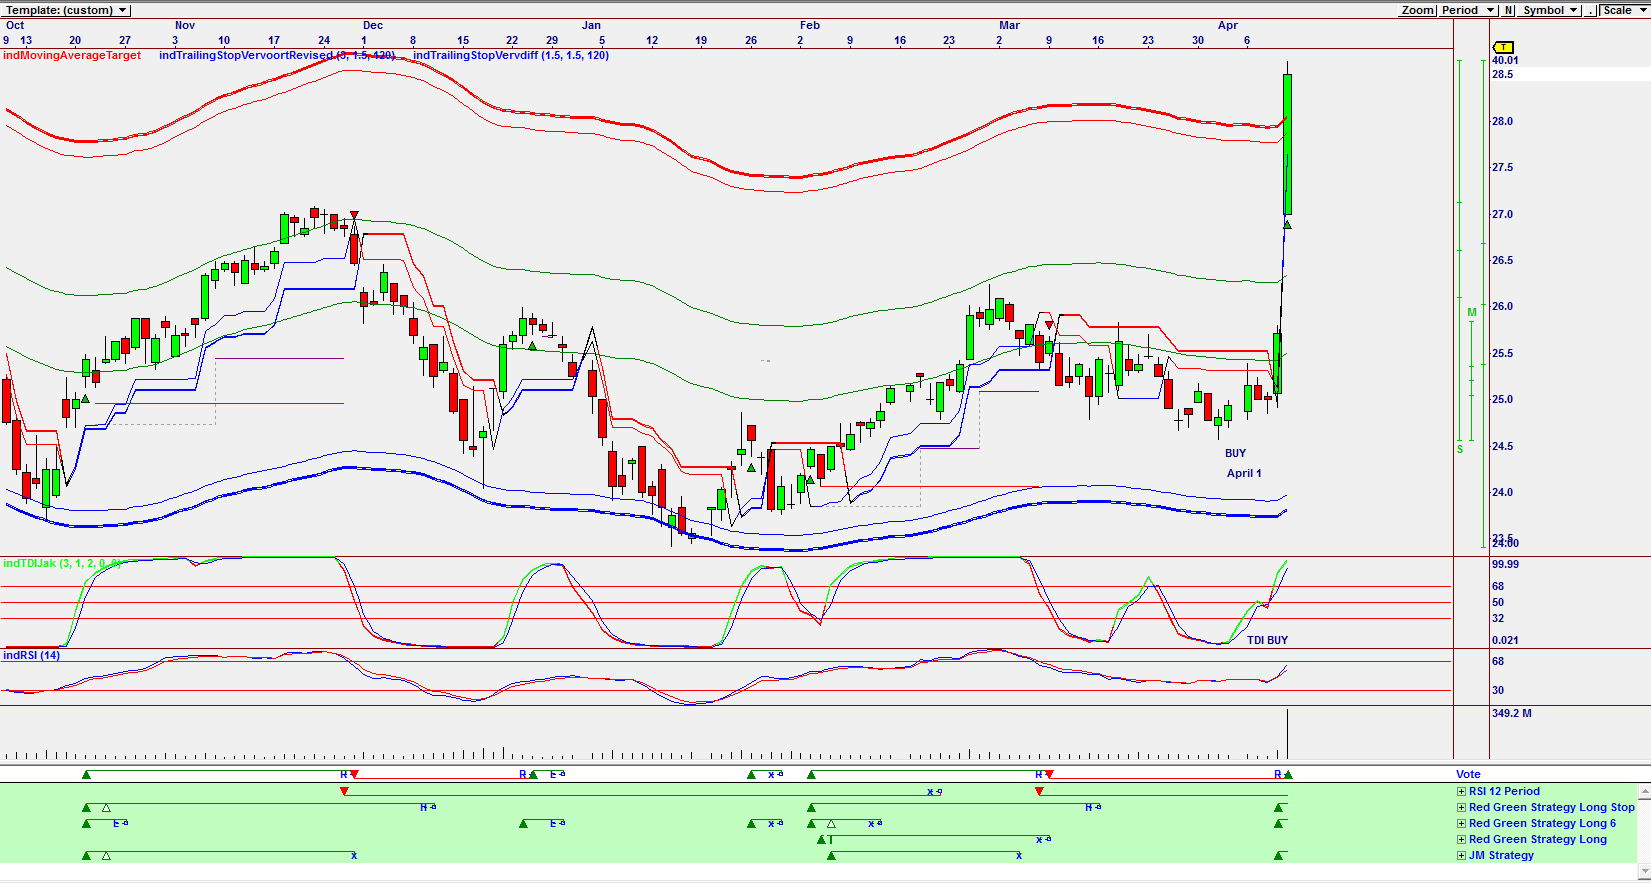
| Figure 3. Daily Omnitrader Chart. A buy signal is given in TDI on April 1, 2015 and a Vote line buy on April 10, 2015. |
| Graphic provided by: Omnitrader. |
| |
| The chart in Figure 3 is an Omnitrader chart showing a TDI buy given on April 1, 2015 and a Vote line buy on April 10, 2015. Of course the TDI buy is for speculators, and the Vote line buy for traders, but with a buy signal triggered on a gap, you would rather stay away and wait for the correction. Fundamentally, GE is a buy at present levels. Technically, it is a 'wait' for a correction, and when that occurs, a buy for the long-term is something to consider. |
Has been a technical analyst since 1969, and has worked as a futures and options trader with First Financial Futures in Johannesburg, South Africa.
| Address: | 3256 West 24th Ave |
| Vancouver, BC | |
| Phone # for sales: | 6042634214 |
| E-mail address: | petroosp@gmail.com |
Click here for more information about our publications!
PRINT THIS ARTICLE

Request Information From Our Sponsors
- StockCharts.com, Inc.
- Candle Patterns
- Candlestick Charting Explained
- Intermarket Technical Analysis
- John Murphy on Chart Analysis
- John Murphy's Chart Pattern Recognition
- John Murphy's Market Message
- MurphyExplainsMarketAnalysis-Intermarket Analysis
- MurphyExplainsMarketAnalysis-Visual Analysis
- StockCharts.com
- Technical Analysis of the Financial Markets
- The Visual Investor
- VectorVest, Inc.
- Executive Premier Workshop
- One-Day Options Course
- OptionsPro
- Retirement Income Workshop
- Sure-Fire Trading Systems (VectorVest, Inc.)
- Trading as a Business Workshop
- VectorVest 7 EOD
- VectorVest 7 RealTime/IntraDay
- VectorVest AutoTester
- VectorVest Educational Services
- VectorVest OnLine
- VectorVest Options Analyzer
- VectorVest ProGraphics v6.0
- VectorVest ProTrader 7
- VectorVest RealTime Derby Tool
- VectorVest Simulator
- VectorVest Variator
- VectorVest Watchdog
