HOT TOPICS LIST
- MACD
- Fibonacci
- RSI
- Gann
- ADXR
- Stochastics
- Volume
- Triangles
- Futures
- Cycles
- Volatility
- ZIGZAG
- MESA
- Retracement
- Aroon
INDICATORS LIST
LIST OF TOPICS
PRINT THIS ARTICLE
by Donald W. Pendergast, Jr.
Costco's mammoth, six-year rally may be at or very near its termination point.
Position: N/A
Donald W. Pendergast, Jr.
Freelance financial markets writer and online publisher of the Trendzetterz.com S&P 500 Weekly Forecast service.
PRINT THIS ARTICLE
CYCLES
Costco: Weekly Sell Signal Triggers
04/15/15 03:16:44 PMby Donald W. Pendergast, Jr.
Costco's mammoth, six-year rally may be at or very near its termination point.
Position: N/A
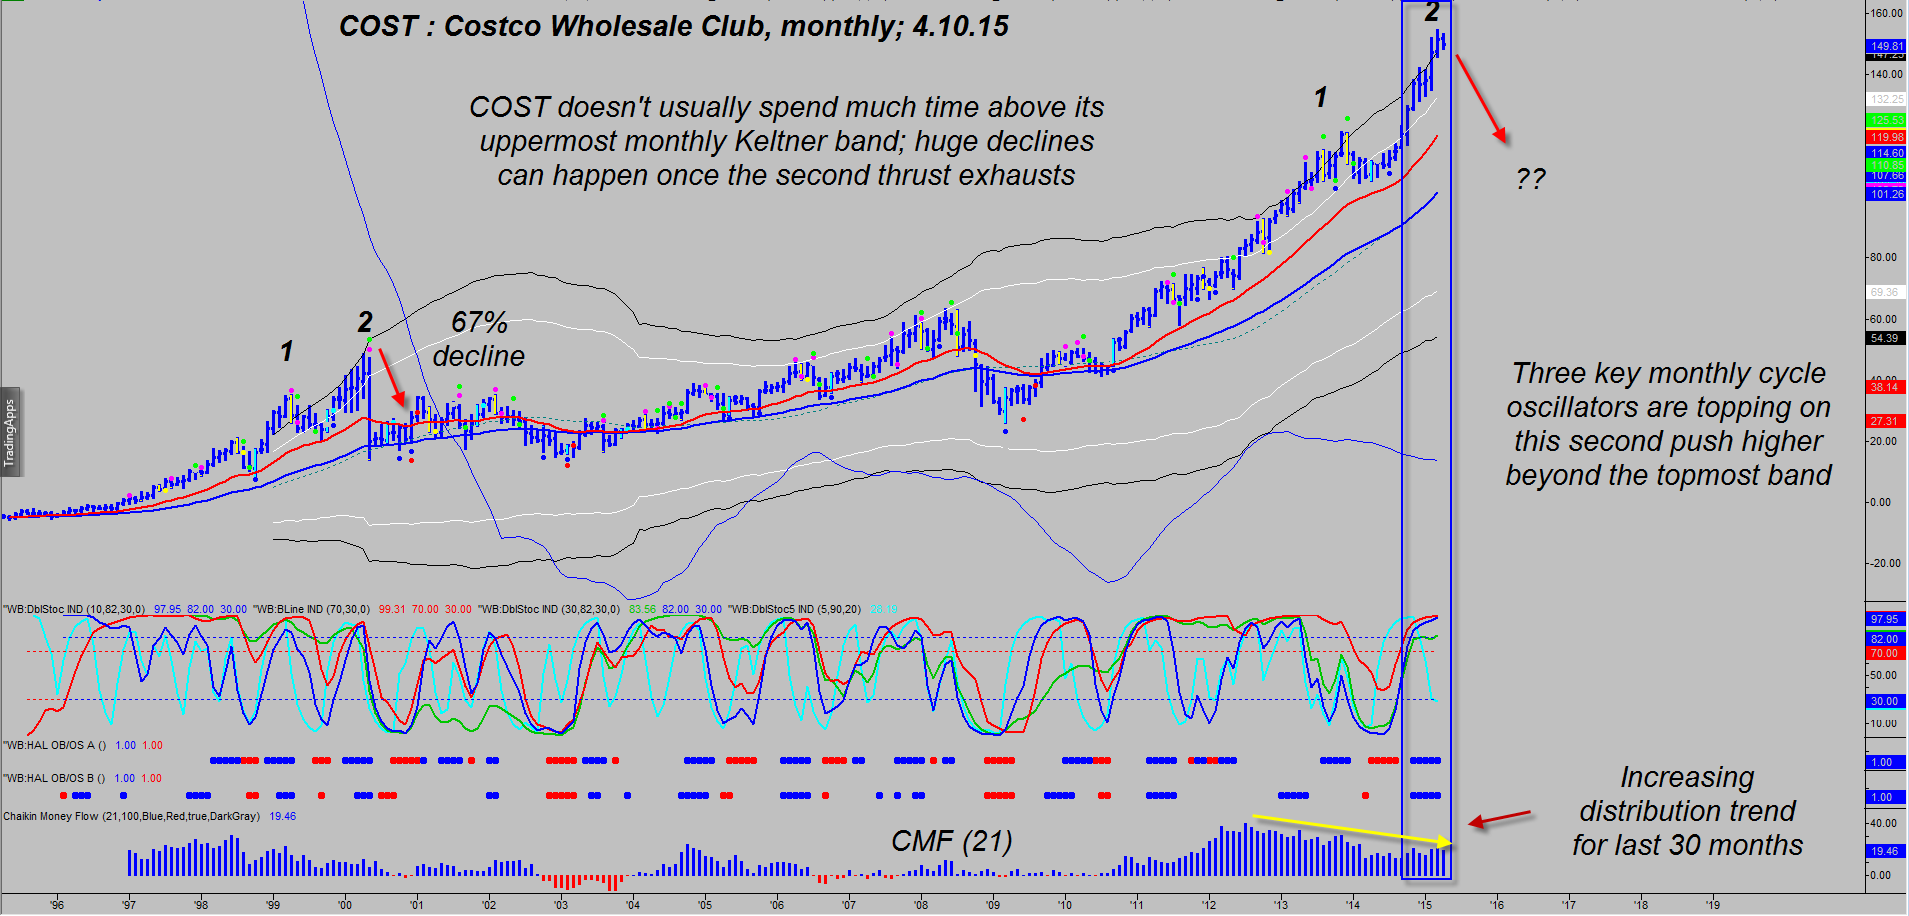
| From its bargain-basement March 2009 low of 26.18, shares of Costco Wholesale Club (COST) proceeded to rally by as much as 489% by late March 2015, and are still trading within a few percent of that all-time high — but most likely not for much longer. Many important technical dynamics have combined to suggest that this steady, long-term bull market performer has finally peaked, with a proportional process of correction directly ahead. Here's a closer look now. |

|
| Figure 1. Monthly Chart Of Costco Wholesale Club (COST): With this major retail stock now making a second strong push back above its topmost Keltner band, the probabilities increase for a deep correction — as the 67% decline seen after a similar occurrence back in April/May 2000 will attest to. |
| Graphic provided by: TradeStation. |
| Graphic provided by: ProfitTrader7 from www.walterbressert.com. |
| |
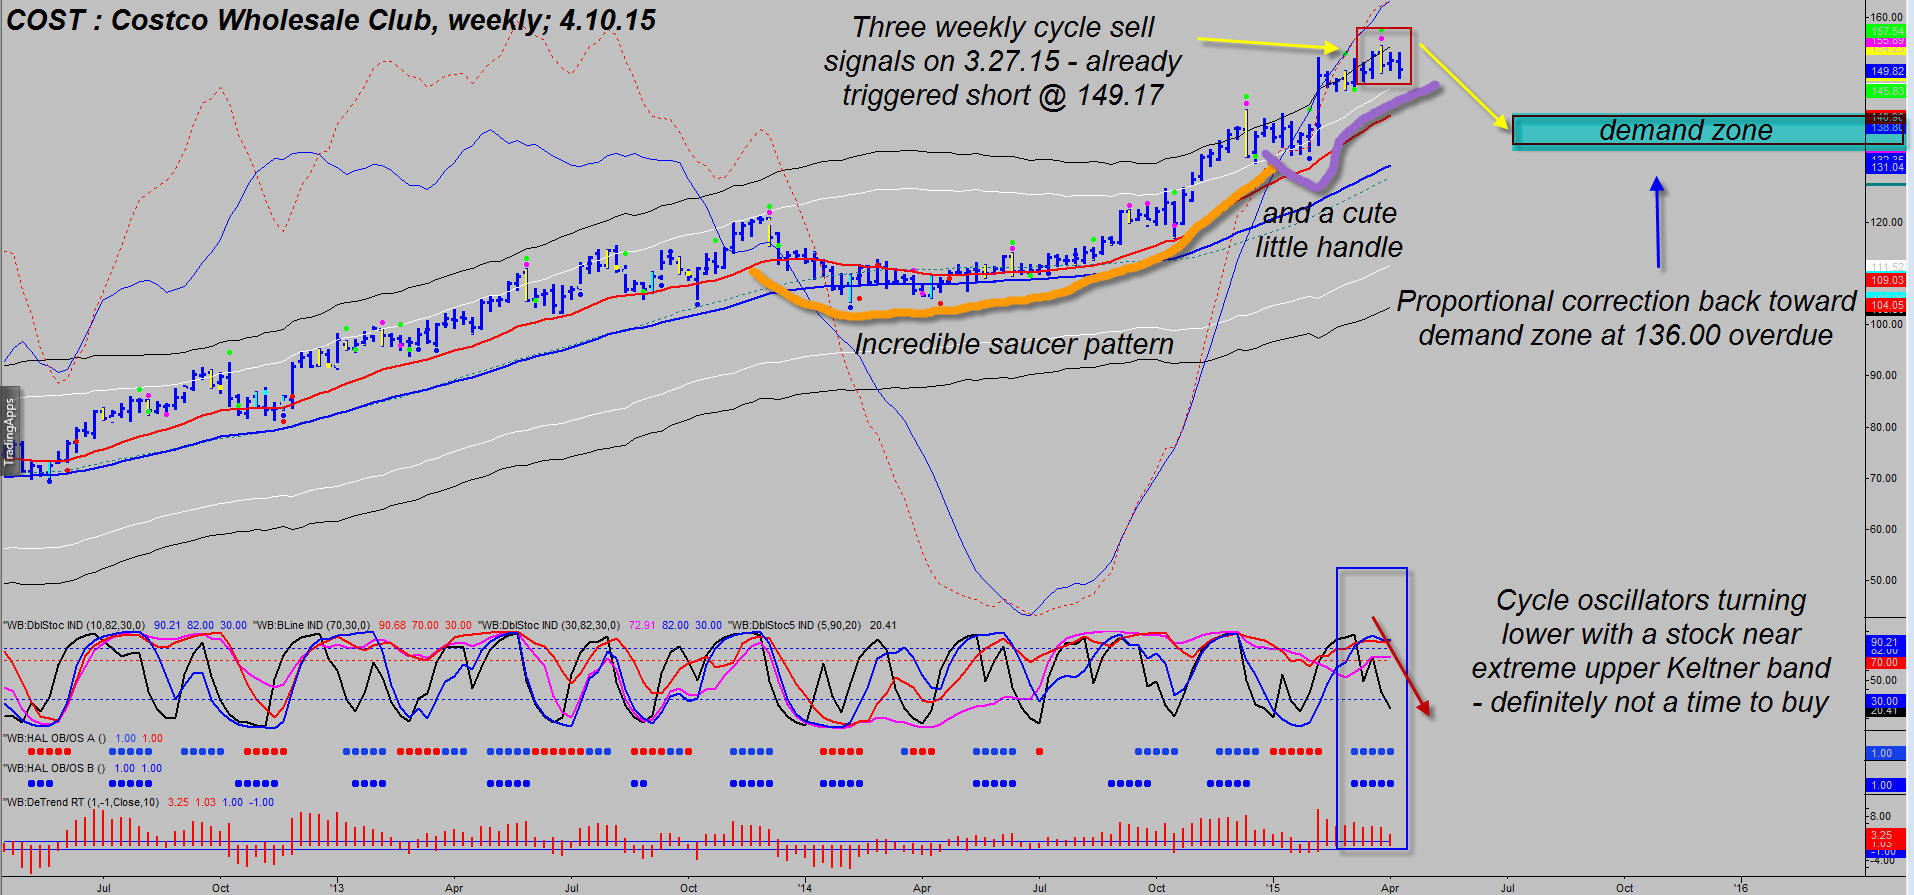
| The long-term uptrend (using the monthly chart in Figure 1 for reference) for COST is impressive and instructive for savvy traders and investors: 1. Note that the stock traded within its Keltner bands (four band, plus a mid-line, all set at key deviation levels), that is, until the rally phase lasting from November 2014 into March 2015. At that point a classic "throw over" pattern became evident; what this typically signifies is a final mad push higher by latecomer retail investors desperate to get in of some more upside on the stock. The "smart money" of course are selling heavily into these late stage rallies, using the retail trader to lighten up their holdings. Once the last retail trader has bought at the ultimate top, why of course the smart money will begin shorting the stock aggressively. Now you know why most retail traders/investors don't have a prayer in the markets — unless they can use technical charts to help spot these kinds of distribution setups well in advance. 2. This late stage rally commenced after a rare and beautiful saucer formation (Figure 2) manifested during the first seven months of 2014; not surprisingly a nice rally ensued. Anytime you locate a smooth saucer bottom (especially on weekly charts) you may have an excellent chance of getting in on a powerful trend following move on a daily time frame chart. 3. COST began to trade well above its uppermost Keltner bands on its monthly chart too, with its 21-month Chaikin money flow (CMF)(21) histogram also confirming that massive distribution was underway. 4. A threesome of cycle oscillator sell signals also triggered a short entry on the weekly chart as COST dropped back below 149.17. As this is written, the stock is trading at 149.90 and skilled traders should be able to locate a suitable short entry point on a 60-minute or daily chart without any problem at all if they wish to go short at a more opportune price level than the original sell trigger price. 5. Once in the short trade, traders can focus on the 134.00 to 138.00 area as high-demand profit taking target zones; even the 138.00 level is more than 6% below today's current price, making this a low-risk, high probability trade setup. |

|
| Figure 2. Weekly Chart. Now that the lovely saucer pattern has completed, at a statistically extreme overbought price level, the appearance of three weekly cycle oscillator sell signals all but confirms this massive rally is ready to correct soon. |
| Graphic provided by: TradeStation. |
| Graphic provided by: ProfitTrader7 from www.walterbressert.com. |
| |
| Buying slightly in-the-money puts with at least three months of remaining time value would be a good opportunity for those wishing to make maximum use of their margin accounts, but shorting the stock is equally doable, too. Just be aware that COST is expected to release earnings in a couple of weeks and that every once in awhile this stock can have an unanticipated move in either direction after the news is out. Risk only 1-2% of your account equity on this short setup and remember to trade wisely until we meet here again. |
Freelance financial markets writer and online publisher of the Trendzetterz.com S&P 500 Weekly Forecast service.
| Title: | Market consultant and writer |
| Company: | Trendzetterz |
| Address: | 81 Hickory Hollow Drive |
| Crossville, TN 38555 | |
| Phone # for sales: | 904-303-4814 |
| Website: | trendzetterz.com |
| E-mail address: | support@trendzetterz.com |
Traders' Resource Links | |
| Trendzetterz has not added any product or service information to TRADERS' RESOURCE. | |
Click here for more information about our publications!
PRINT THIS ARTICLE

Request Information From Our Sponsors
- StockCharts.com, Inc.
- Candle Patterns
- Candlestick Charting Explained
- Intermarket Technical Analysis
- John Murphy on Chart Analysis
- John Murphy's Chart Pattern Recognition
- John Murphy's Market Message
- MurphyExplainsMarketAnalysis-Intermarket Analysis
- MurphyExplainsMarketAnalysis-Visual Analysis
- StockCharts.com
- Technical Analysis of the Financial Markets
- The Visual Investor
- VectorVest, Inc.
- Executive Premier Workshop
- One-Day Options Course
- OptionsPro
- Retirement Income Workshop
- Sure-Fire Trading Systems (VectorVest, Inc.)
- Trading as a Business Workshop
- VectorVest 7 EOD
- VectorVest 7 RealTime/IntraDay
- VectorVest AutoTester
- VectorVest Educational Services
- VectorVest OnLine
- VectorVest Options Analyzer
- VectorVest ProGraphics v6.0
- VectorVest ProTrader 7
- VectorVest RealTime Derby Tool
- VectorVest Simulator
- VectorVest Variator
- VectorVest Watchdog
