

HOT TOPICS LIST
- MACD
- Fibonacci
- RSI
- Gann
- ADXR
- Stochastics
- Volume
- Triangles
- Futures
- Cycles
- Volatility
- ZIGZAG
- MESA
- Retracement
- Aroon
INDICATORS LIST
LIST OF TOPICS
PRINT THIS ARTICLE
by Chaitali Mohile
A breakout rally of Delek US Holding stock is likely to start another strong bullish trend.
Position: Buy
Chaitali Mohile
Active trader in the Indian stock markets since 2003 and a full-time writer. Trading is largely based upon technical analysis.
PRINT THIS ARTICLE
BREAKOUTS
DK Ready For A Fresh Breakout
04/08/15 04:03:03 PMby Chaitali Mohile
A breakout rally of Delek US Holding stock is likely to start another strong bullish trend.
Position: Buy
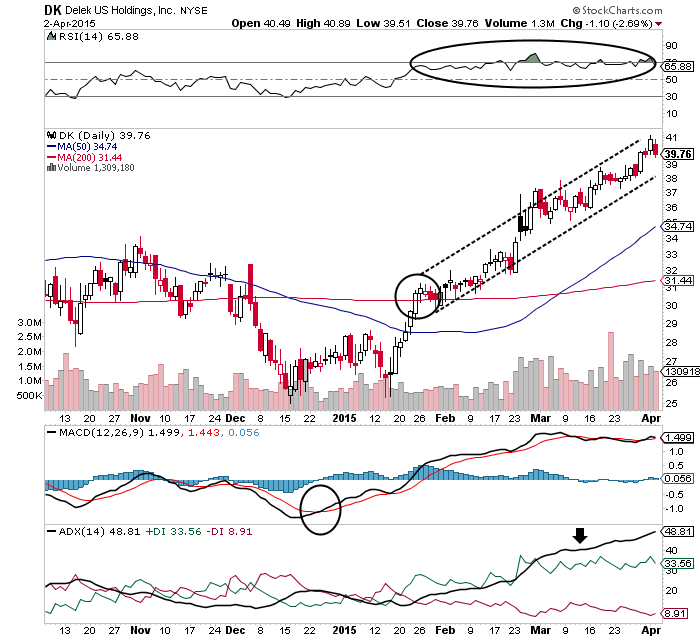
| Delek US Holding (DK) was under bearish pressure in late 2014. The daily time frame chart in Figure 1 shows price movement tangling between the two moving averages (MA). Eventually, the stock plunged below the 200-day MA and formed a bottom. A pullback rally initiated in January 2015 developed a fresh uptrend. Earlier, the average directional index (ADX)(14) in Figure 1 showed an uncertain and volatile road for DK. The relief rally generated fresh buying pressure that eventually pulled the ADX line above 20 levels. A white candlestick formed below the 200-day MA reflecting an upcoming bullish strength in the rally. |
|
| Figure 1. DAILY CHART OF DELEK US HOLDINGS INC. (DK). The stock of DK has been seeing a nice rally since February 2015. Will the strength of the rally continue? |
| Graphic provided by: StockCharts.com. |
| |
| Gradually, the stock underwent a bullish moving average breakout in January 2015. After the breakout, the rally began losing strength. However, the stock continued moving higher. Although the ADX surged to a well developed region (above 30 levels), the stock remained volatile. The tricky movement of the relative strength index (RSI)(14) near 70 levels, kept the buyer in a dilemma. Although the wide gap between the green line (positive directional index) and red line (negative directional index) shows increase in buying pressure and stability in trend, the stock lacked bullish strength. However, the upward rally formed an ascending channel, offering easy support-resistance levels for long positions. |
| If the stock plunges a few points due to an overheated uptrend, the lower trendline of an ascending channel would offer strong support. The moving average convergence/divergence (MACD)(12,26,9) suggests volatility in a future bullish rally. |
|
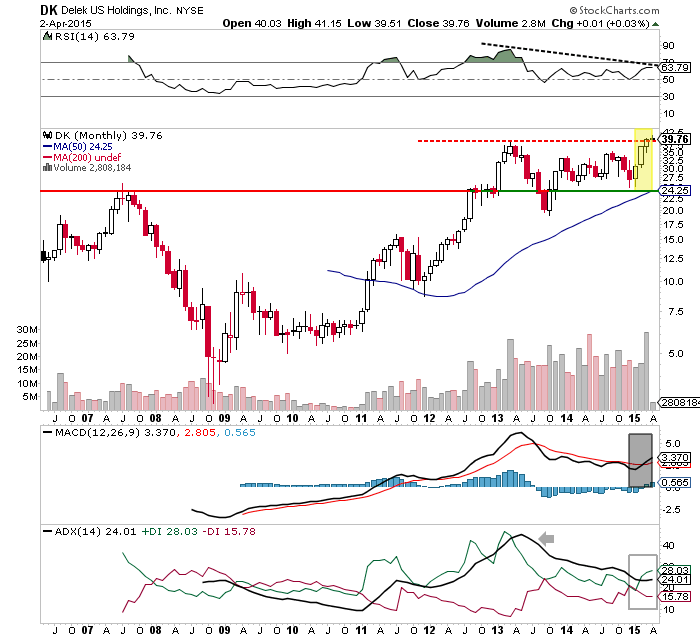
| Figure 2. MONTHLY CHART OF DK. The stock has high a previous high at the $39.75 levels. The ADX(14), MACD(12, 26, 9), and RSI(14) indicate bullish strength. |
| Graphic provided by: StockCharts.com. |
| |
| According to the monthly time frame chart in Figure 2, the overbought conditions of the technical indicators terminated the bullish breakout in 2013. Recently, the stock hit the previous high at $39.75 levels. The ADX(14) is showing a developing uptrend, the MACD(12, 26, 9) is undergoing a bullish crossover in positive territory, and the RSI(14) is rallying in a bullish zone between 50 and 60 levels. This suggests a successful potential bullish breakout of DK. The three white candles, though not exactly a three white soldiers' candlestick pattern, show bullish development in the rally. The stock could remain a little reluctant near its resistance level. The previous high pivot (red-green line) in Figure 2 would act as robust support. |
| To conclude, traders should watch DK as one of the best stocks to trigger a long position in the near future. However, they should also look for confirmed buying signals from the indicators. |
Active trader in the Indian stock markets since 2003 and a full-time writer. Trading is largely based upon technical analysis.
| Company: | Independent |
| Address: | C1/3 Parth Indraprasth Towers. Vastrapur |
| Ahmedabad, Guj 380015 | |
| E-mail address: | chaitalimohile@yahoo.co.in |
Traders' Resource Links | |
| Independent has not added any product or service information to TRADERS' RESOURCE. | |
Click here for more information about our publications!
PRINT THIS ARTICLE

Request Information From Our Sponsors
- StockCharts.com, Inc.
- Candle Patterns
- Candlestick Charting Explained
- Intermarket Technical Analysis
- John Murphy on Chart Analysis
- John Murphy's Chart Pattern Recognition
- John Murphy's Market Message
- MurphyExplainsMarketAnalysis-Intermarket Analysis
- MurphyExplainsMarketAnalysis-Visual Analysis
- StockCharts.com
- Technical Analysis of the Financial Markets
- The Visual Investor
- VectorVest, Inc.
- Executive Premier Workshop
- One-Day Options Course
- OptionsPro
- Retirement Income Workshop
- Sure-Fire Trading Systems (VectorVest, Inc.)
- Trading as a Business Workshop
- VectorVest 7 EOD
- VectorVest 7 RealTime/IntraDay
- VectorVest AutoTester
- VectorVest Educational Services
- VectorVest OnLine
- VectorVest Options Analyzer
- VectorVest ProGraphics v6.0
- VectorVest ProTrader 7
- VectorVest RealTime Derby Tool
- VectorVest Simulator
- VectorVest Variator
- VectorVest Watchdog