

HOT TOPICS LIST
- MACD
- Fibonacci
- RSI
- Gann
- ADXR
- Stochastics
- Volume
- Triangles
- Futures
- Cycles
- Volatility
- ZIGZAG
- MESA
- Retracement
- Aroon
INDICATORS LIST
LIST OF TOPICS
PRINT THIS ARTICLE
by Donald W. Pendergast, Jr.
Up by as much as much as 199% between November 2012 and March 2015, shares of Anthem, Inc. are now in prime position to stage a proportional correction.
Position: Sell
Donald W. Pendergast, Jr.
Freelance financial markets writer and online publisher of the Trendzetterz.com S&P 500 Weekly Forecast service.
PRINT THIS ARTICLE
CYCLES
ANTM: Cycle Highs On Three Time Frames
04/06/15 05:23:44 PMby Donald W. Pendergast, Jr.
Up by as much as much as 199% between November 2012 and March 2015, shares of Anthem, Inc. are now in prime position to stage a proportional correction.
Position: Sell
| A large cap stock in a major bull run can go higher than anyone might logically believe — especially if it's already up by 50, 80 or even 100% — and that's why it's so dangerous to attempt to call a major top until several key factors all begin to come into perfect alignment. Right now, those key major top factors are already in place for Anthem, Inc. (ANTM) and a high probability decline most likely will be well underway by the end of this spring. Here's a closer look now. |
|
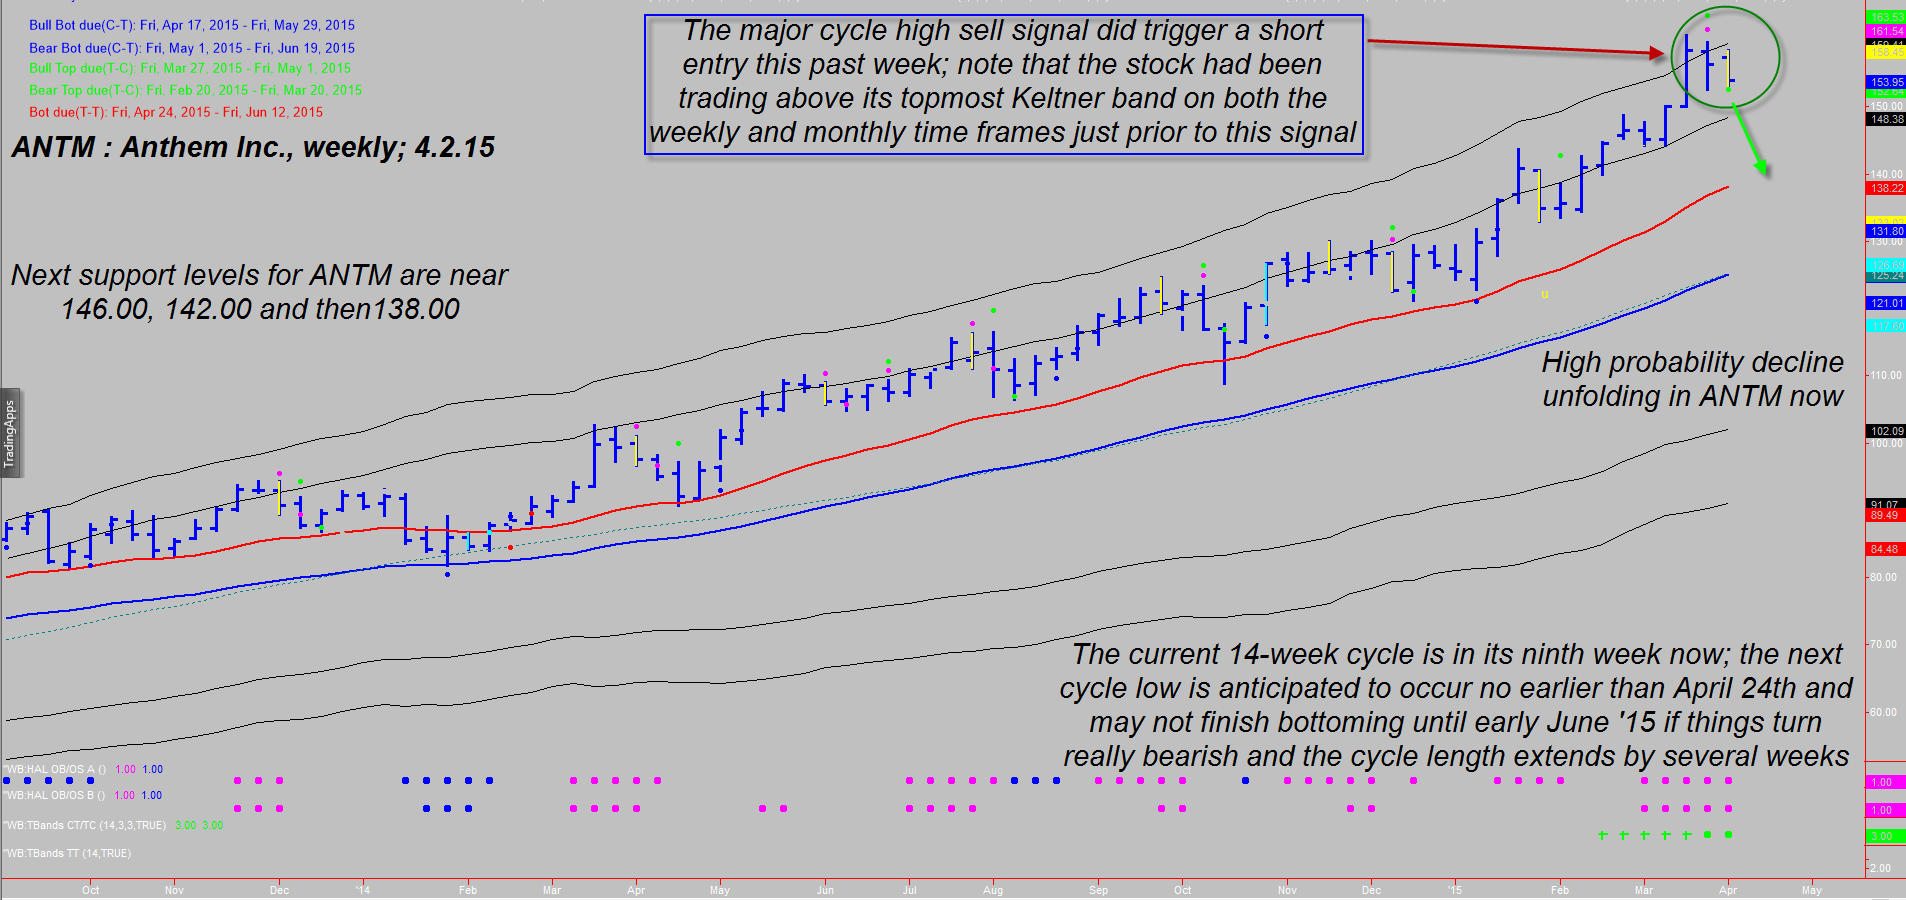
| Figure 1. Weekly Chart Of Anthem Inc. (ANTM): Three cycle oscillator sell signals were triggered this past week; with both the weekly and monthly charts in high-probability overbought zones, ANTM should see significant follow-through down into the mid 140s-soon. |
| Graphic provided by: TradeStation. |
| Graphic provided by: ProfitTrader7 from www.walterbressert.com. |
| |
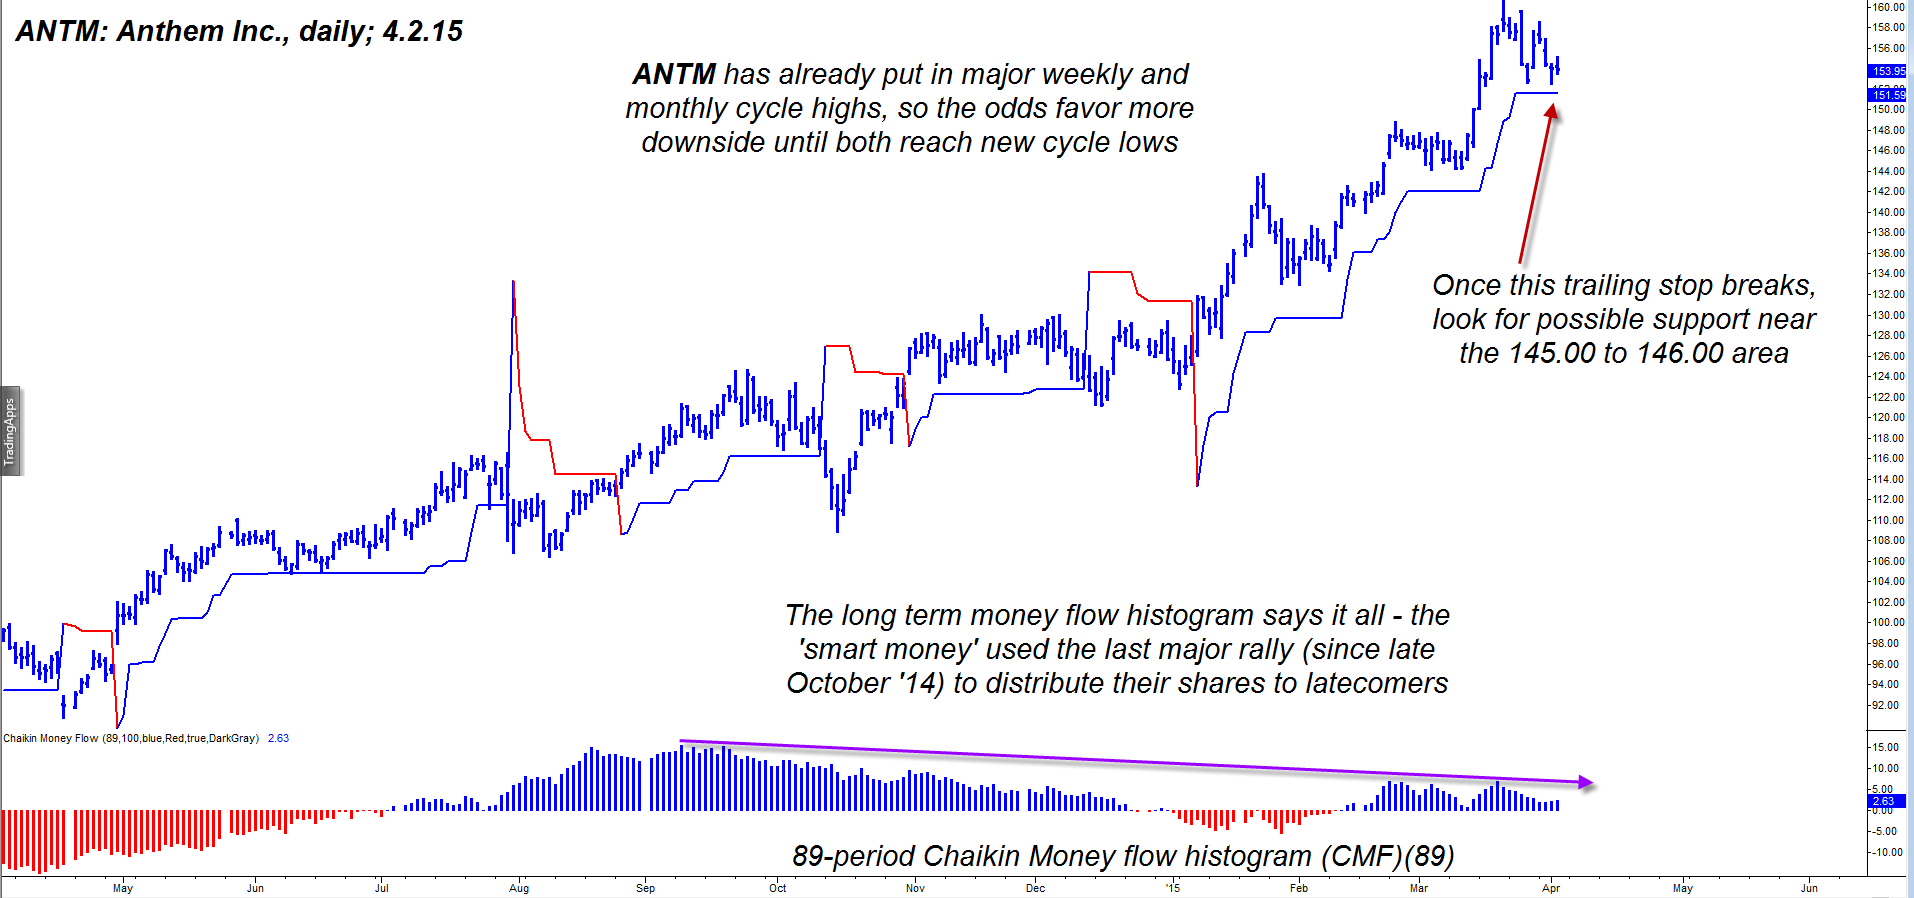
| With ANTM's daily, weekly and monthly charts all now confirming with about 95% probability that the high for the entire rally since November 2012 is already in place, let's lay out all of the supporting evidence: 1. The weekly (Figure 1) and monthly charts both reached statistically overbought extremes on the last push up to the March 2015 high of 160.64 — both went above their respective uppermost Keltner bands and both also printed a series of green overbought bands, which are reliable confirmations of a move at an exhaustion phase. 2. Long-term money flows on the daily (Figure 2), weekly, and monthly charts all confirm the same thing — the "smart money" has been using the latest up thrust in ANTM to distribute their shares to latecomer retail trader sheep just prior to the inevitable market slaughter. See the daily chart's 89-period Chaikin money flow (CMF)(89) histogram if you need visual confirmation. 3. The weekly chart issued three simultaneous sell setup signals for the week ending March 27, 2015; this setup was triggered this week as ANTM dropped beneath 152.64. Cycle high sell signals occurring as three major time frames are at/near exhaustion zones are signals to pay attention to, particularly if the smart money is distributing shares in a big way. 4. Cycles analysis is suggesting that the very earliest to expect a bottom is April 24, 2015 and there is a 70% probability that ANTM will bottom in the current cycle by June 9, 2015. Of course, there is still a 30% chance that the cycle low will occur even later than that, as is often the case as a cycle is stretched due to unusually strong price action (bullish or bearish, as the case may be). 5. Volume analysis shows that the next real support level for ANTM doesn't occur until 146.00, with other (stronger) support levels near 142.00 and 135.00 to 138.00. 6. The daily chart's dynamic trailing stop (DTS) is close to being violated to the downside; once this line breaks, it will be strong confirmation that the "smart money" (mutual funds, banks, hedge funds) will be taking this stock lower, shorting heavily to capitalize on the negative dynamics previously mentioned. When you learn to use such trails within the context of proper cycles analysis, you will find that you can easily create your own trading systems and may never need to spend big bucks for market advice or overpriced trading signal subscriptions ever again. Always remember that cycles, support/resistance, volume, and money flow analysis are the four key ingredients that cause every tradable trend to: a. Begin b. Follow through (after a rest) c. Terminate Put all this together wisely and you will find you need very little else to trade profitably over the long haul. |
|
| Figure 2. Daily Chart Of ANTM. ANTM's trailing stop, if broken soon, will likely unleash a great deal of short selling pressure as weekly and monthly cycles move lower. The next meaningful support is near 146.00. |
| Graphic provided by: TradeStation. |
| Graphic provided by: Dynamic Trailing Stop by Fibozachi.com. |
| |
| Knowing that the cycles on three major time frames have peaked and are turning lower will help aggressive traders to pick high probability, low-risk places to short ANTM and/or to buy put options with four to six months time value. It's your call, but anyway you trade it, ANTM looks like a cinch to hit 146.00 within the next few weeks if not sooner. Trade wisely until we meet here again. |
Freelance financial markets writer and online publisher of the Trendzetterz.com S&P 500 Weekly Forecast service.
| Title: | Market consultant and writer |
| Company: | Trendzetterz |
| Address: | 81 Hickory Hollow Drive |
| Crossville, TN 38555 | |
| Phone # for sales: | 904-303-4814 |
| Website: | trendzetterz.com |
| E-mail address: | support@trendzetterz.com |
Traders' Resource Links | |
| Trendzetterz has not added any product or service information to TRADERS' RESOURCE. | |
Click here for more information about our publications!
Comments

Request Information From Our Sponsors
- StockCharts.com, Inc.
- Candle Patterns
- Candlestick Charting Explained
- Intermarket Technical Analysis
- John Murphy on Chart Analysis
- John Murphy's Chart Pattern Recognition
- John Murphy's Market Message
- MurphyExplainsMarketAnalysis-Intermarket Analysis
- MurphyExplainsMarketAnalysis-Visual Analysis
- StockCharts.com
- Technical Analysis of the Financial Markets
- The Visual Investor
- VectorVest, Inc.
- Executive Premier Workshop
- One-Day Options Course
- OptionsPro
- Retirement Income Workshop
- Sure-Fire Trading Systems (VectorVest, Inc.)
- Trading as a Business Workshop
- VectorVest 7 EOD
- VectorVest 7 RealTime/IntraDay
- VectorVest AutoTester
- VectorVest Educational Services
- VectorVest OnLine
- VectorVest Options Analyzer
- VectorVest ProGraphics v6.0
- VectorVest ProTrader 7
- VectorVest RealTime Derby Tool
- VectorVest Simulator
- VectorVest Variator
- VectorVest Watchdog