

HOT TOPICS LIST
- MACD
- Fibonacci
- RSI
- Gann
- ADXR
- Stochastics
- Volume
- Triangles
- Futures
- Cycles
- Volatility
- ZIGZAG
- MESA
- Retracement
- Aroon
INDICATORS LIST
LIST OF TOPICS
PRINT THIS ARTICLE
by Donald W. Pendergast, Jr.
When a weekly and monthly cycle top at around the same time, expect a tradable correction to soon follow.
Position: N/A
Donald W. Pendergast, Jr.
Freelance financial markets writer and online publisher of the Trendzetterz.com S&P 500 Weekly Forecast service.
PRINT THIS ARTICLE
CYCLES
Apple: Intial Stages Of A Sizeable Correction?
03/31/15 03:22:25 PMby Donald W. Pendergast, Jr.
When a weekly and monthly cycle top at around the same time, expect a tradable correction to soon follow.
Position: N/A
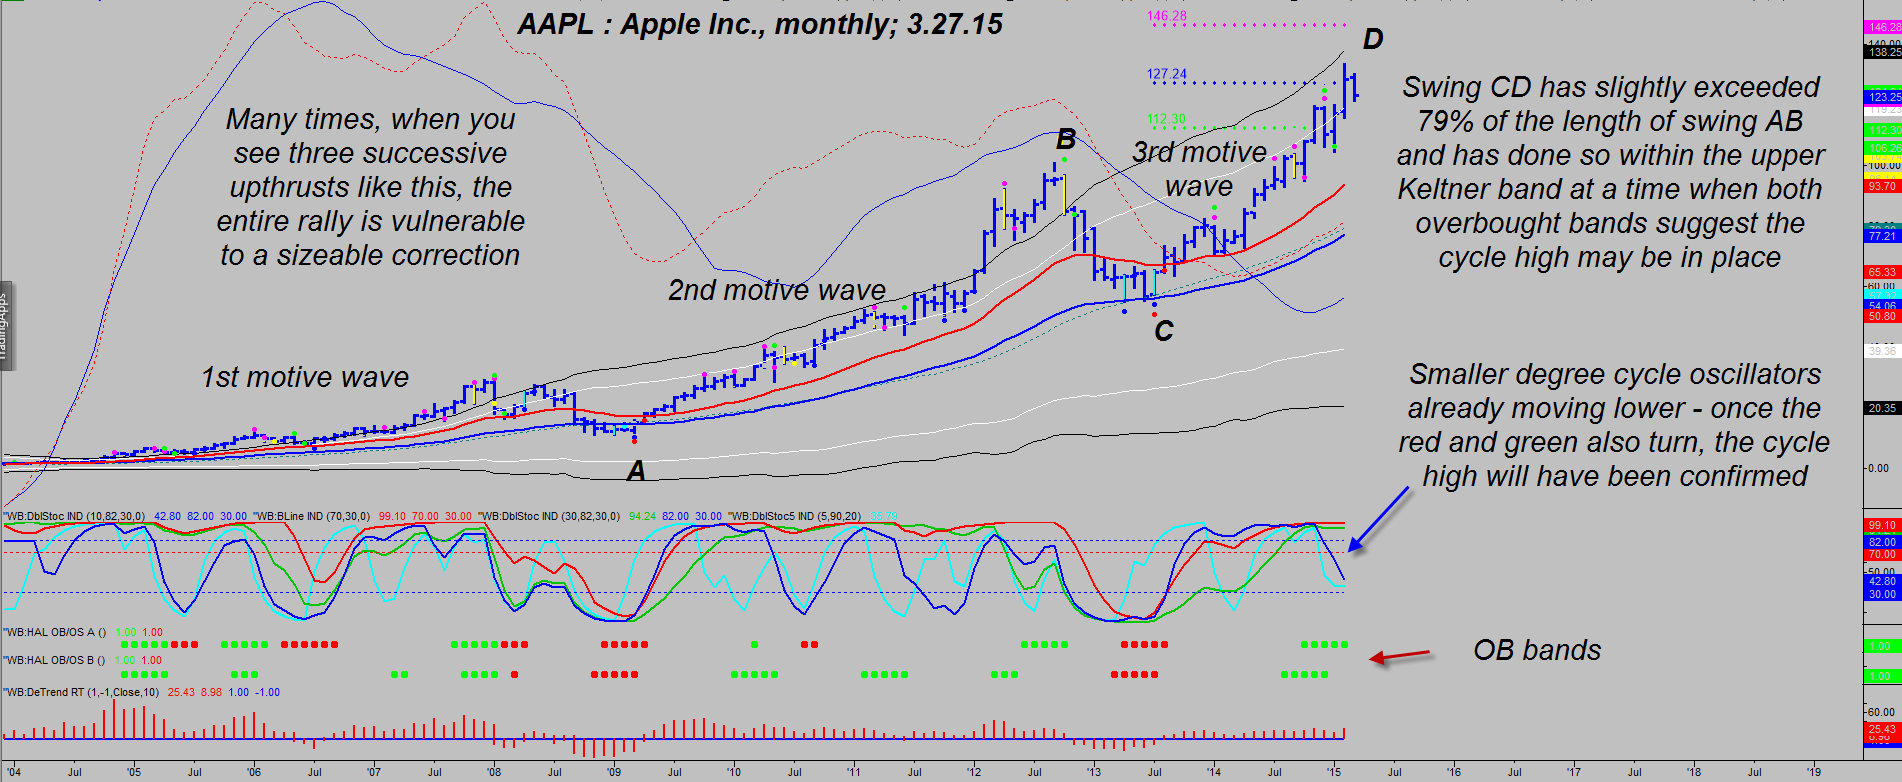
| The decade-plus rally seen in shares of Apple Inc. (AAPL) since late 2003 has seen three enormous up thrusts — known in Elliott wave parlance as motive waves — and these three gigantic waves have combined to lift the stock from $0.91 all the way to its recent all-time high of 133.60. While some fundamental analysts and chartists are calling for even more upside in AAPL during 2015, its weekly and monthly charts are suggesting otherwise to those who use various forms of cycles analysis. Here's a closer look now. |
|
| Figure 1. Monthly Chart Of Apple Inc. (AAPL): Swing CD appears to be terminating as the stock enters a high probability cycle high reversal zone. |
| Graphic provided by: TradeStation. |
| Graphic provided by: ProfitTrader7 from www.walterbressert.com. |
| |
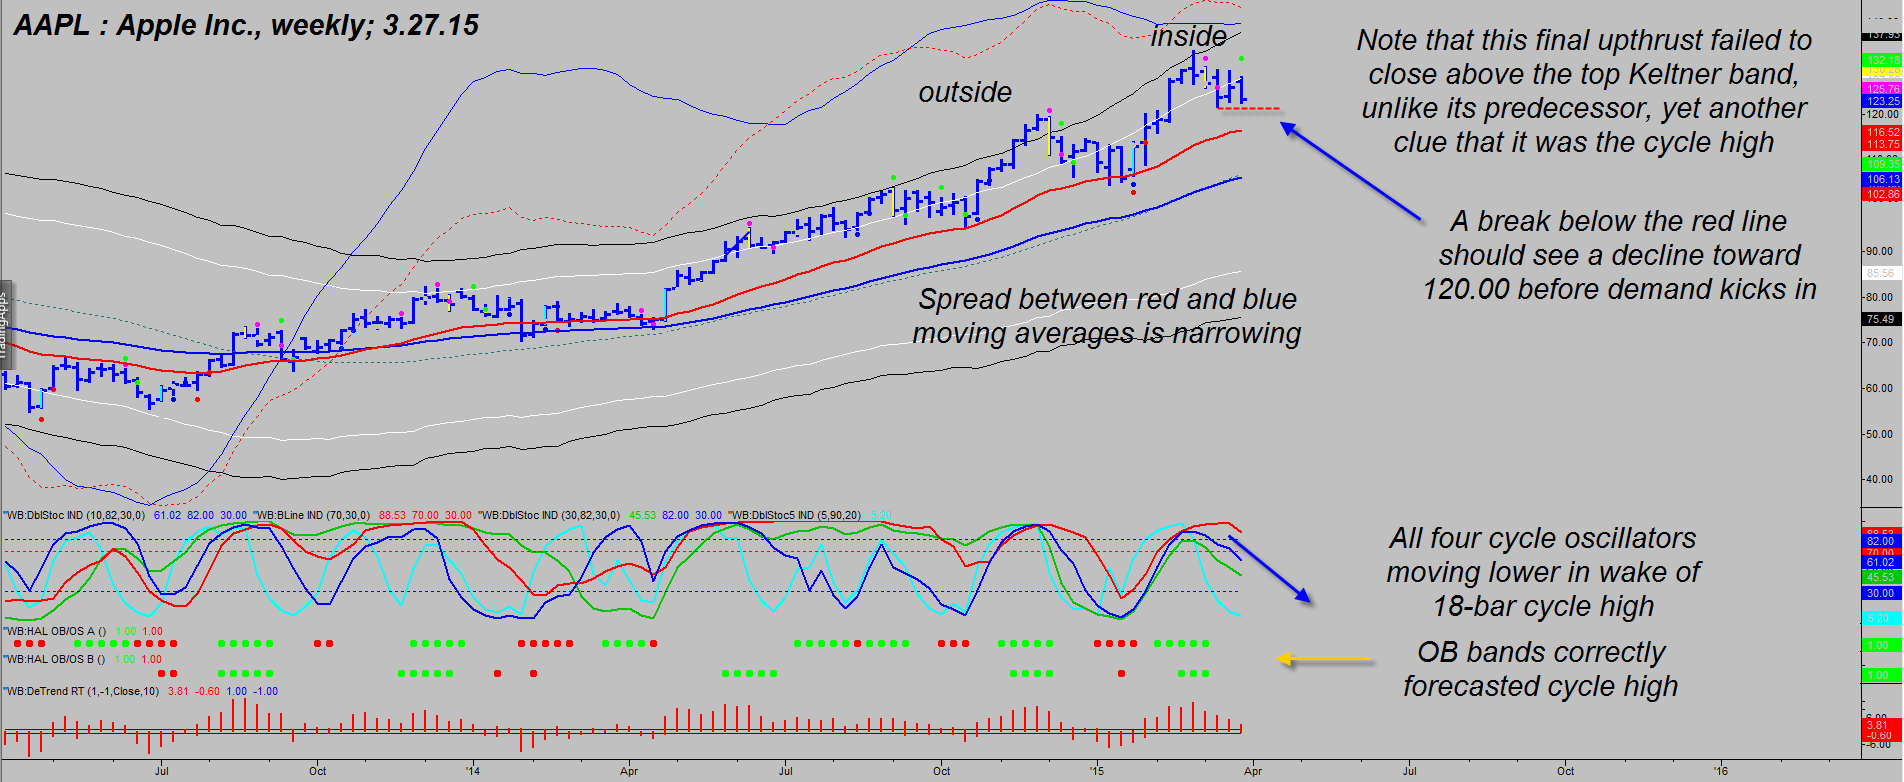
| The cycles situation currently unfolding on AAPL's weekly/monthly charts looks like a textbook example of the beginning stages of what could be a major trend reversal. Some of the most obvious (and not so obvious) technical evidence includes the following: 1. The monthly chart (Figure 1) is now well into the overbought band (OB) zone at the same time that its latest up thrust has failed to close back above the upper Keltner band. 2. Swing CD has traveled about 85% of the distance as swing AB; if February's monthly low of 116.00 is breached soon, it will mean swing CD is complete. However, if there is an unexpected bullish reversal and AAPL charges higher again (above the February 2015 high of 133.60) then the next higher swing CD target of 146.28 has a good chance of being reached within the next few months. 3. Two of the four monthly cycle oscillators are already moving sharply lower; the red and green ones are based on higher degree cycles and once they both begin to turn lower it will be yet another confirmation that the trend reversal is gaining momentum. 4. The monthly chart clearly reveals the three major bullish motive waves since 2003; even if this third wave can push higher, smart technicians know it's usually foolish to expect a subsequent fourth motive wave as part of the same series. 5. The weekly chart (Figure 2) reveals increasing bearish momentum, a new weekly oscillator sell signal, four cycle oscillators moving lower together, and a cycle high close back inside the upper Keltner band. When you see a daily/weekly or a weekly/monthly chart combo manifest such bearish agreement, especially after an all-time high and three major bullish motive waves, you can be pretty sure that the so-called "smart money" (Wall Street insiders, mutual funds, hedge funds, etc.) are more than happy to dump as many of their shares of the stock as they can into the hands of latecomer retail traders even as they short the heck out of it. For the pros to win in the trading/investing game, the retail trader has to lose — and almost always does — unless they learn to use at least some of the same tools that the market pros have — such as the cycles tools that were described previously in this article. |
|
| Figure 2. Weekly Chart Of AAPL. Here you see all four of its cycle oscillators moving lower. A break below 122.00 and then 212.63 sets the stage for more downside. |
| Graphic provided by: TradeStation. |
| Graphic provided by: ProfitTrader7 from www.walterbressert.com. |
| |
| With a new weekly sell signal now in force for AAPL, skilled option traders can elect to buy slightly in the money puts with at least six to eight months of time value remaining to take advantage of what could be at least a 15-25% correction in AAPL between now and late summer. A secondary sell signal occurs once the red support line at 121.63 breaks, and a third sell signal kicks in once the February 2015 low of 116.80 is taken out. At that point — should that happen within a month or two — it will be the monthly cycles exerting the main downward pressure on AAPL and the declines could be beyond 20%. After a 12 year rally to such extremes, such a sell-off would not be uncommon and could even help set the stage for further gains in 2016 and beyond. Trade wisely until we meet here again. |
Freelance financial markets writer and online publisher of the Trendzetterz.com S&P 500 Weekly Forecast service.
| Title: | Market consultant and writer |
| Company: | Trendzetterz |
| Address: | 81 Hickory Hollow Drive |
| Crossville, TN 38555 | |
| Phone # for sales: | 904-303-4814 |
| Website: | trendzetterz.com |
| E-mail address: | support@trendzetterz.com |
Traders' Resource Links | |
| Trendzetterz has not added any product or service information to TRADERS' RESOURCE. | |
Click here for more information about our publications!
Comments

Request Information From Our Sponsors
- VectorVest, Inc.
- Executive Premier Workshop
- One-Day Options Course
- OptionsPro
- Retirement Income Workshop
- Sure-Fire Trading Systems (VectorVest, Inc.)
- Trading as a Business Workshop
- VectorVest 7 EOD
- VectorVest 7 RealTime/IntraDay
- VectorVest AutoTester
- VectorVest Educational Services
- VectorVest OnLine
- VectorVest Options Analyzer
- VectorVest ProGraphics v6.0
- VectorVest ProTrader 7
- VectorVest RealTime Derby Tool
- VectorVest Simulator
- VectorVest Variator
- VectorVest Watchdog
- StockCharts.com, Inc.
- Candle Patterns
- Candlestick Charting Explained
- Intermarket Technical Analysis
- John Murphy on Chart Analysis
- John Murphy's Chart Pattern Recognition
- John Murphy's Market Message
- MurphyExplainsMarketAnalysis-Intermarket Analysis
- MurphyExplainsMarketAnalysis-Visual Analysis
- StockCharts.com
- Technical Analysis of the Financial Markets
- The Visual Investor