HOT TOPICS LIST
- MACD
- Fibonacci
- RSI
- Gann
- ADXR
- Stochastics
- Volume
- Triangles
- Futures
- Cycles
- Volatility
- ZIGZAG
- MESA
- Retracement
- Aroon
INDICATORS LIST
LIST OF TOPICS
PRINT THIS ARTICLE
by Koos van der Merwe
This is the way I analyze a share for a possible future purchase.
Position: Accumulate
Koos van der Merwe
Has been a technical analyst since 1969, and has worked as a futures and options trader with First Financial Futures in Johannesburg, South Africa.
PRINT THIS ARTICLE
STRATEGIES
Analyzing Bombardier
11/14/02 10:11:52 AMby Koos van der Merwe
This is the way I analyze a share for a possible future purchase.
Position: Accumulate
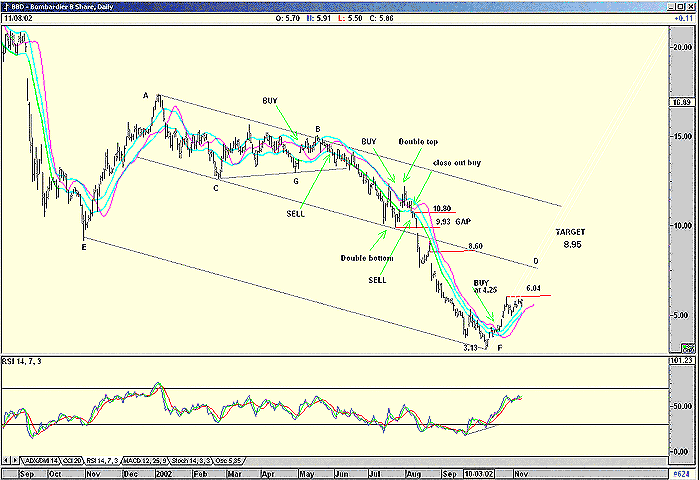
| In the chart of the company Bombardier, I have drawn in a number of support and resistance lines as the share moved downwards. The first line I drew was the AB line from point A to point B and then extended it. |
| I then drew a parallel line from point C, the low of February 27, 2002 and extended it to D. I had hoped that the company would rally when it bounced off the CG support line, and broke above the JM upper band at B, but the reversal, giving a SELL signal when it broke below the JM lower band line soon after, was disappointing. |

|
| Bombardier B Shares |
| Graphic provided by: AdvancedGET. |
| |
| The next ray of hope came when it fell to the CD support level, a line parallel to AB and drawn from point C. When the price formed a double bottom at 9.93, and broke above the JM band line, giving a buy signal, I believed that the downtrend had been reversed. But it soon broke downwards through the optimized moving average (maroon line) closing out the long position, and then through the lower JM band line at 10.80 giving a sell signal, soon to break the support level of 9.93 and gapping down. I realized that the share was indeed a short sell. I then looked for a bottom, and drew the parallel support line of EF from point F, not believing that the share would fall that low, but allowing the short position to run, and watching my stops. When the share starting recovering and touched the lower JM band line, I considered closing my short. But the share did not rise further, and in fact gapped down from $8.60 and kept falling until it found the support line at F. From here it rose above the JM lower band and the upper band closing out my short and giving me a BUY signal at $4.25 at the same time. |
| At the moment it appears to be forming a cup and saucer pattern, with a handle breakout at 6.04. The RSI indicator after giving a divergence buy at 4.25 is still rising. The point and figure horizontal count gives a target of 15.5 with the vertical count at 11. Both are a bit ambitious at the moment. I should wait for a break above 6.04, the resistance of the CD line whenever and at whatever price that may be, then finally the two gaps of 8.60 and 9.93. After that will come the main resistance level of the AB line. The target of 15.5 could be many, many months in the future, but the vertical count target of $11 could be sometime in December, should the price break through the target levels. |
| The most likely target would be that of the cup and saucer pattern, calculated as follows: 6.04 - 3.13 = 2.91 + 6.04 = 8.95. My risk/reward scenario of 2.5:1 is therefore calculated as follows: At an entry level of 6.04, with a stop-loss at 10 percent would be 60 cents. My profit would be $2.91, much higher than the $1.50 (2.5 * 60c) needed, so I have ample margin for error. So I watch and wait. |
Has been a technical analyst since 1969, and has worked as a futures and options trader with First Financial Futures in Johannesburg, South Africa.
| Address: | 3256 West 24th Ave |
| Vancouver, BC | |
| Phone # for sales: | 6042634214 |
| E-mail address: | petroosp@gmail.com |
Click here for more information about our publications!
Comments
Date: 11/19/02Rank: 5Comment:
Date: 11/22/02Rank: 4Comment:
Date: 11/30/02Rank: 2Comment:

|

Request Information From Our Sponsors
- StockCharts.com, Inc.
- Candle Patterns
- Candlestick Charting Explained
- Intermarket Technical Analysis
- John Murphy on Chart Analysis
- John Murphy's Chart Pattern Recognition
- John Murphy's Market Message
- MurphyExplainsMarketAnalysis-Intermarket Analysis
- MurphyExplainsMarketAnalysis-Visual Analysis
- StockCharts.com
- Technical Analysis of the Financial Markets
- The Visual Investor
- VectorVest, Inc.
- Executive Premier Workshop
- One-Day Options Course
- OptionsPro
- Retirement Income Workshop
- Sure-Fire Trading Systems (VectorVest, Inc.)
- Trading as a Business Workshop
- VectorVest 7 EOD
- VectorVest 7 RealTime/IntraDay
- VectorVest AutoTester
- VectorVest Educational Services
- VectorVest OnLine
- VectorVest Options Analyzer
- VectorVest ProGraphics v6.0
- VectorVest ProTrader 7
- VectorVest RealTime Derby Tool
- VectorVest Simulator
- VectorVest Variator
- VectorVest Watchdog
