

HOT TOPICS LIST
- MACD
- Fibonacci
- RSI
- Gann
- ADXR
- Stochastics
- Volume
- Triangles
- Futures
- Cycles
- Volatility
- ZIGZAG
- MESA
- Retracement
- Aroon
INDICATORS LIST
LIST OF TOPICS
PRINT THIS ARTICLE
by Donald W. Pendergast, Jr.
Shares of Edwards Lifesciences enjoyed a good week of gains last week but cycles analysis says the majority of this current upswing may be complete.
Position: N/A
Donald W. Pendergast, Jr.
Freelance financial markets writer and online publisher of the Trendzetterz.com S&P 500 Weekly Forecast service.
PRINT THIS ARTICLE
CYCLES
EW: Getting Overextended On Upside?
03/24/15 04:18:46 PMby Donald W. Pendergast, Jr.
Shares of Edwards Lifesciences enjoyed a good week of gains last week but cycles analysis says the majority of this current upswing may be complete.
Position: N/A
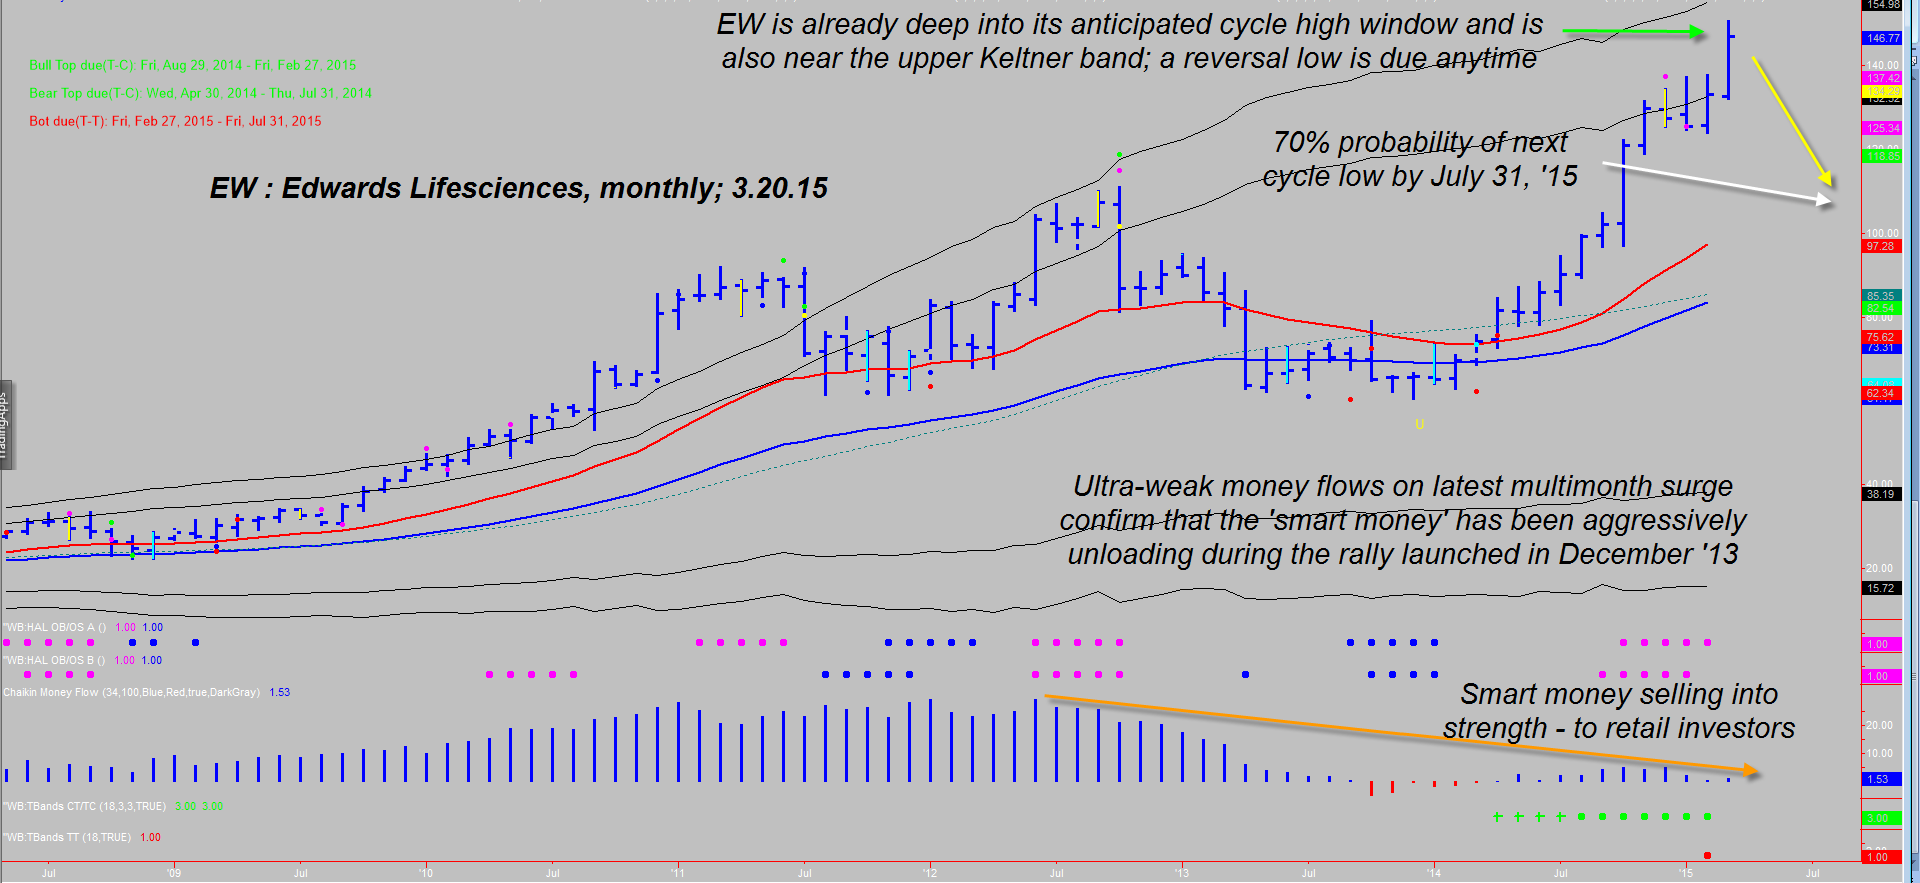
| Having risen by nearly 150% since mid-December 2013, shares of Edwards Lifesciences (EW), at first glance, appear to be on a non-stop elevator ride to ever higher valuations; that may be true in the near-term, but many technical dynamics are now suggesting that this health sector issue is running on borrowed time — and the smart money sells into this latest push higher. Here's a closer look now (Figure 1). |
|
| Figure 1: Monthly Chart of Edwards Lifesciences (EW). This high flyer is up by nearly 150% in 15 months but is already in a high probability cycle-high time window. It's next monthly cycle low has a 70% probability of forming by July 31, 2015. |
| Graphic provided by: TradeStation. |
| Graphic provided by: ProfitTrader7 from www.walterbressert.com. |
| |
| For those currently long EW here are the early warning signs that suggest that the use of logical trailing stops, put option protection or progressive profit-taking strategies might be a wise move in the weeks just ahead: 1. Money flows are weakening across the board, on five successive time frames including the 13-, 21-, 34-, 55-, and 89-week Chaikin money flow histograms (CMF). This is always the case as a long-term bull trend gradually loses institutional buying interest, and that's because the institutions use each successive rally in a major trend to unload their shares to starry eyed newcomers (the typical retail trader). Hopefully, if you've been a long-term subscriber here, you already know how to avoid being the patsy who buys into a late stage rally rather than being the wise trader who sells into such terminal strength. To make matters worse for existing longs, the monthly money flow histogram shows one of the most pronounced long-term distribution patterns that this technician has ever witnessed on any large cap stock. A major sell off is approaching, at least according to this reliable visual clue. 2. Cycles analysis suggests that the monthly cycle is at or near a "major" top (as in all capital letters) even as the weekly cycle is approaching a possible bull-to-bear phase transition. 3. Here's the real clincher that a major top is getting close — the monthly chart is almost touching its extreme upper Keltner band (currently near 155.00) and that is a high probability stopping zone, given that the stock has run so hard since December 2013 with only one minor monthly pullback along the way. 4. The detrend oscillator on both the weekly and monthly charts reveal bearish divergence. 5. The two key moving average spread calculations that help confirm trend have both shifted into a negative momentum phase on the weekly chart. 6. Yet another powerful clue that EW has entered a major monthly cycle high window is that its 18-week cycle is deep within its anticipated turning window. |
|
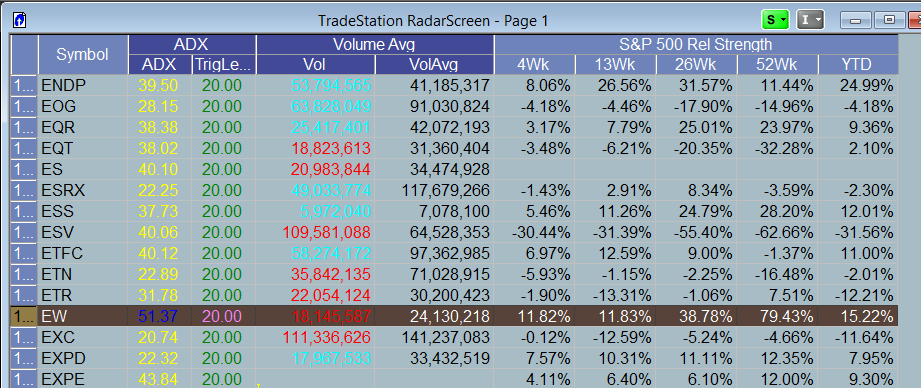
| Figure 2. Relative Performance. EW is far outperforming the S&P 500 index (.SPX) over the past 52 weeks, but with the smart money selling heavily into this latest rally (15 months old), look for this situation to change soon. |
| Graphic provided by: TradeStation. |
| Graphic provided by: TradeStation 9.1 RadarScreen. |
| |
| Taken as a whole, the cycles, momentum, and money flow picture presented by EW are telling existing longs to start thinking about — and deploying — a suitable exit strategy. Furthermore, once the inevitable trend reversal kicks in, the bears should have little trouble finding great sell short opportunities that are likely to appear — and which may appear for some time, given the mammoth extent of this stock's bullish surge over the past 15 months. Another stock to watch is Kroger Co. (KR), which is also in ridiculous valuation territory and is at over stretched cycle highs on both its weekly and monthly time frames; the sell short ops on this one should also be a doozy, but only time will tell. Trust what your charts are telling you and learn to rely on cold hard statistics and not on emotions and you may do very well when such high fliers eventually turn down in a big way. Trade wisely and profitably until we meet here again. |
Freelance financial markets writer and online publisher of the Trendzetterz.com S&P 500 Weekly Forecast service.
| Title: | Market consultant and writer |
| Company: | Trendzetterz |
| Address: | 81 Hickory Hollow Drive |
| Crossville, TN 38555 | |
| Phone # for sales: | 904-303-4814 |
| Website: | trendzetterz.com |
| E-mail address: | support@trendzetterz.com |
Traders' Resource Links | |
| Trendzetterz has not added any product or service information to TRADERS' RESOURCE. | |
Click here for more information about our publications!
PRINT THIS ARTICLE

Request Information From Our Sponsors
- VectorVest, Inc.
- Executive Premier Workshop
- One-Day Options Course
- OptionsPro
- Retirement Income Workshop
- Sure-Fire Trading Systems (VectorVest, Inc.)
- Trading as a Business Workshop
- VectorVest 7 EOD
- VectorVest 7 RealTime/IntraDay
- VectorVest AutoTester
- VectorVest Educational Services
- VectorVest OnLine
- VectorVest Options Analyzer
- VectorVest ProGraphics v6.0
- VectorVest ProTrader 7
- VectorVest RealTime Derby Tool
- VectorVest Simulator
- VectorVest Variator
- VectorVest Watchdog
- StockCharts.com, Inc.
- Candle Patterns
- Candlestick Charting Explained
- Intermarket Technical Analysis
- John Murphy on Chart Analysis
- John Murphy's Chart Pattern Recognition
- John Murphy's Market Message
- MurphyExplainsMarketAnalysis-Intermarket Analysis
- MurphyExplainsMarketAnalysis-Visual Analysis
- StockCharts.com
- Technical Analysis of the Financial Markets
- The Visual Investor