

HOT TOPICS LIST
- MACD
- Fibonacci
- RSI
- Gann
- ADXR
- Stochastics
- Volume
- Triangles
- Futures
- Cycles
- Volatility
- ZIGZAG
- MESA
- Retracement
- Aroon
INDICATORS LIST
LIST OF TOPICS
PRINT THIS ARTICLE
by Chaitali Mohile
After hitting a 52-week high, AAR Corp. is struggling to surge into a fresh bullish zone.
Position: Hold
Chaitali Mohile
Active trader in the Indian stock markets since 2003 and a full-time writer. Trading is largely based upon technical analysis.
PRINT THIS ARTICLE
BREAKOUTS
AAR Corp. Getting Ready For A Breakout
03/23/15 05:34:55 PMby Chaitali Mohile
After hitting a 52-week high, AAR Corp. is struggling to surge into a fresh bullish zone.
Position: Hold
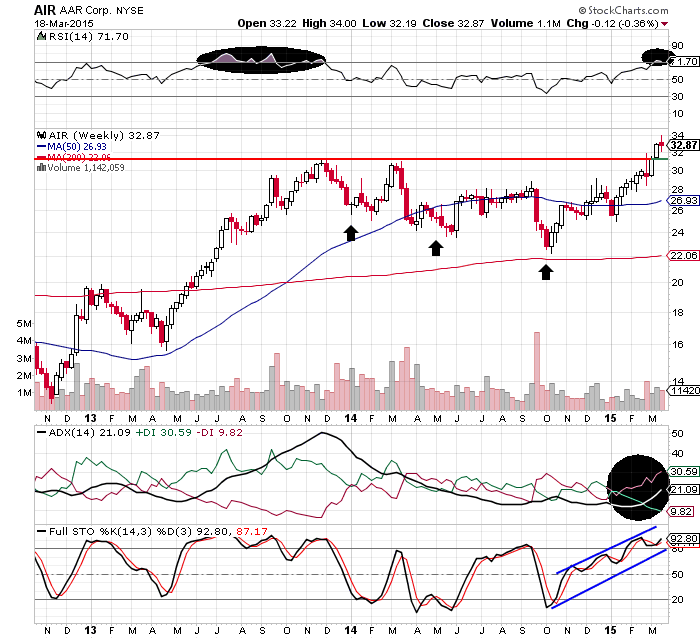
| AAR Corp (AIR), a stock from the aerospace industry, has been consolidating in a wide range for more than a year. The 200-day moving average (MA) acted as a strong support for the sideways rally. A series of lower lows formed on the weekly time frame chart (Figure 1) highlighting bearish pressure in AIR. An overheated uptrend indicated by the average directional index (ADX)(14) and an oversold relative strength index (RSI)(14) were the bearish signals that dragged the price lower. However, the long-term moving average extended its robust support and initiated a fresh upward price action. |
| Recently, AIR has breached resistance at $31 levels, moving to a 52-week high. Since the breakout has occurred after a long consolidation period, it is likely to generate strong bullish sentiments among traders and investors. In addition, the full stochastic oscillator (14,3,3) has climbed into overbought territory indicating bullish momentum in the rally. The uptrend is likely to develop once again, and the RSI(14) is about to reach its previous high resistance. Currently, all the indicators have reached their critical levels, and the price rally has marginally moved above the resistance line in Figure 1. |
|
| Figure 1. Weekly Chart of AAR Corp (AIR). The stock breached resistance and moved to a 52-week high. |
| Graphic provided by: StockCharts.com. |
| |
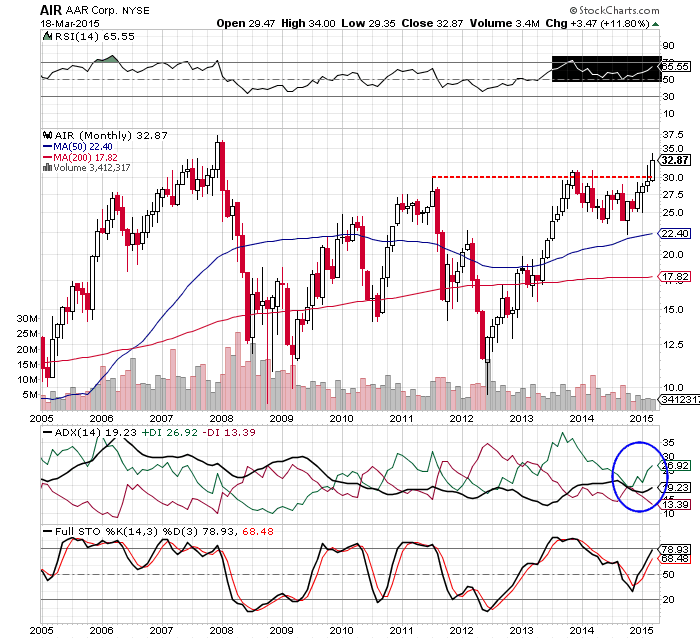
| The monthly time frame chart (Figure 2) shows long-term resistance at $31 levels. The previous high pivot had restricted the bullish price movement of AIR. The pullback rally initiated in 2012 failed to breach the resistance and formed a bearish engulfing pattern near the resistance line. Although the buying pressure indicated by the positive directional index (+DI) of the ADX(14) increased, the uptrend failed to develop. The RSI(14) and stochastic oscillator were weak to sustain in their respective bullish areas. Due to these various reasons the pullback rally reversed in early 2014. |
|
| Figure 2. Monthly Chart of AIR. Will the uptrend develop? |
| Graphic provided by: StockCharts.com. |
| |
| However, the trend reversal resulted in a bullish consolidation below the resistance level. Traders need to be watchful as the stock is ready to undergo a major breakout at $32 levels, thus, converting resistance to robust support. But you cannot follow the price rally in isolation. The bullish movement of the three indicators in Figure 2 confirms the stability of the breakout rally. The ADX(14) has to sustain above 20 levels for developing strong uptrend. The RSI(14) and stochastic have to surge above 60 levels before you open a low risk trading opportunity. |
| AIR is an attractive stock to put on your watchlist. Wait, watch, and grab the trading opportunity when it arises. |
Active trader in the Indian stock markets since 2003 and a full-time writer. Trading is largely based upon technical analysis.
| Company: | Independent |
| Address: | C1/3 Parth Indraprasth Towers. Vastrapur |
| Ahmedabad, Guj 380015 | |
| E-mail address: | chaitalimohile@yahoo.co.in |
Traders' Resource Links | |
| Independent has not added any product or service information to TRADERS' RESOURCE. | |
Click here for more information about our publications!
PRINT THIS ARTICLE

Request Information From Our Sponsors
- VectorVest, Inc.
- Executive Premier Workshop
- One-Day Options Course
- OptionsPro
- Retirement Income Workshop
- Sure-Fire Trading Systems (VectorVest, Inc.)
- Trading as a Business Workshop
- VectorVest 7 EOD
- VectorVest 7 RealTime/IntraDay
- VectorVest AutoTester
- VectorVest Educational Services
- VectorVest OnLine
- VectorVest Options Analyzer
- VectorVest ProGraphics v6.0
- VectorVest ProTrader 7
- VectorVest RealTime Derby Tool
- VectorVest Simulator
- VectorVest Variator
- VectorVest Watchdog
- StockCharts.com, Inc.
- Candle Patterns
- Candlestick Charting Explained
- Intermarket Technical Analysis
- John Murphy on Chart Analysis
- John Murphy's Chart Pattern Recognition
- John Murphy's Market Message
- MurphyExplainsMarketAnalysis-Intermarket Analysis
- MurphyExplainsMarketAnalysis-Visual Analysis
- StockCharts.com
- Technical Analysis of the Financial Markets
- The Visual Investor