HOT TOPICS LIST
- MACD
- Fibonacci
- RSI
- Gann
- ADXR
- Stochastics
- Volume
- Triangles
- Futures
- Cycles
- Volatility
- ZIGZAG
- MESA
- Retracement
- Aroon
INDICATORS LIST
LIST OF TOPICS
PRINT THIS ARTICLE
by Koos van der Merwe
With interest rates in the United States unlikely to rise in 2015, should retirees look for a steady and reliable income stream in REITS?
Position: Accumulate
Koos van der Merwe
Has been a technical analyst since 1969, and has worked as a futures and options trader with First Financial Futures in Johannesburg, South Africa.
PRINT THIS ARTICLE
TECHNICAL ANALYSIS
SL Green Realty Corp.
03/17/15 02:23:33 PMby Koos van der Merwe
With interest rates in the United States unlikely to rise in 2015, should retirees look for a steady and reliable income stream in REITS?
Position: Accumulate
| The interest rate rise did not appear in 2014 and it seems unlikely that it will appear in 2015. In the latest Monetary Policy Committee minutes, the members voted unanimously to keep rates at record lows in the face of deflationary pressures. This means that income from secure investments like government bonds will remain low. Investors will start looking for alternative sources, and Retirement Income Trusts that pay a good yield could be the answer. One of those worth looking at is SL Green Realty Corp. (SLG). The company focuses on owning and operating office buildings in Manhattan. |

|
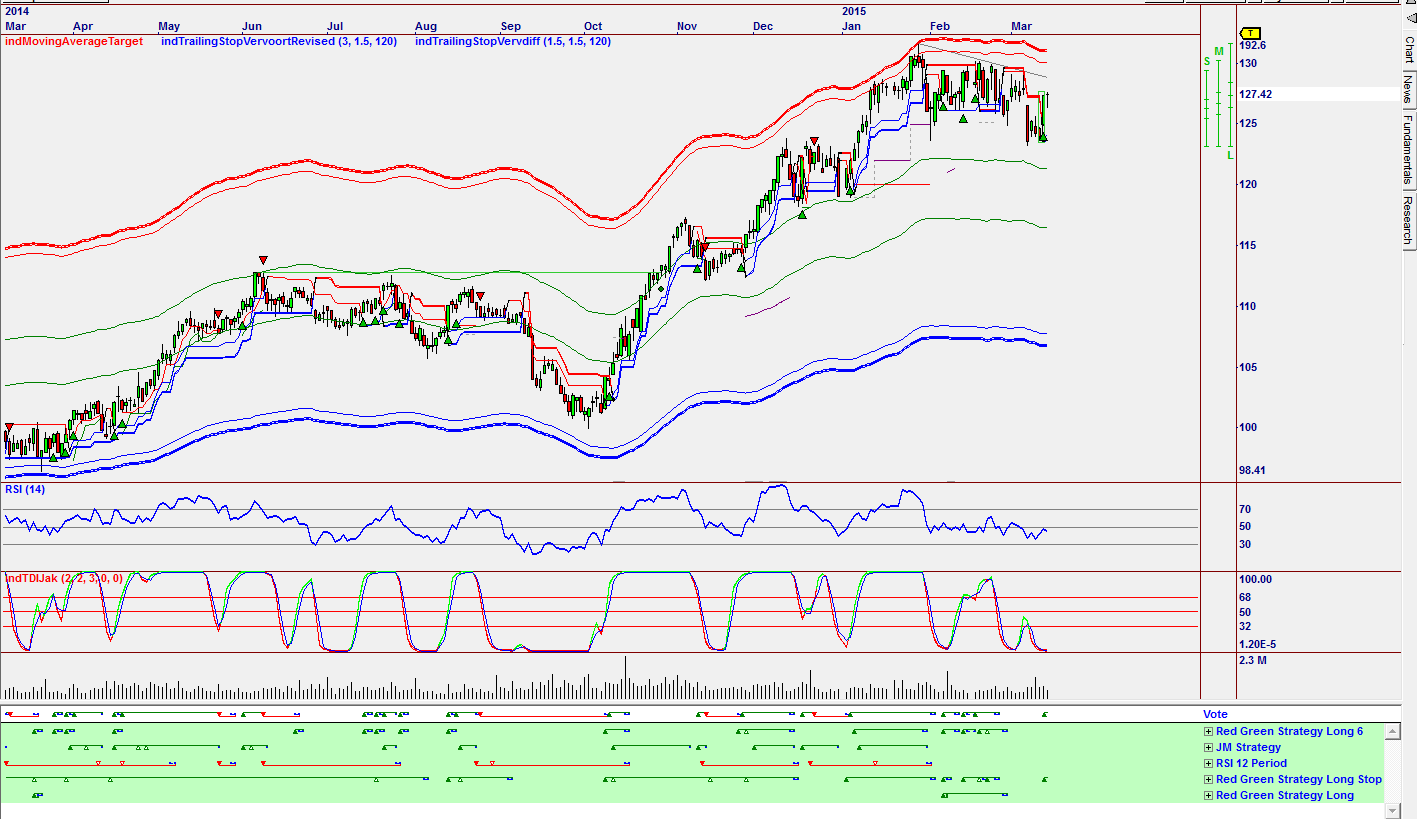
| Figure 1. Omnitrader chart with Vote line suggesting a buy. |
| Graphic provided by: Omnitrader. |
| |
| The chart in Figure 1 is a daily Omnitrader chart with the Vote line suggesting a buy based on the Red Green Strategy Long stop shown in green below the Vote line. The relative strength index (RSI) has not reached oversold levels but the TDIJak indicator is suggesting a buy. |

|
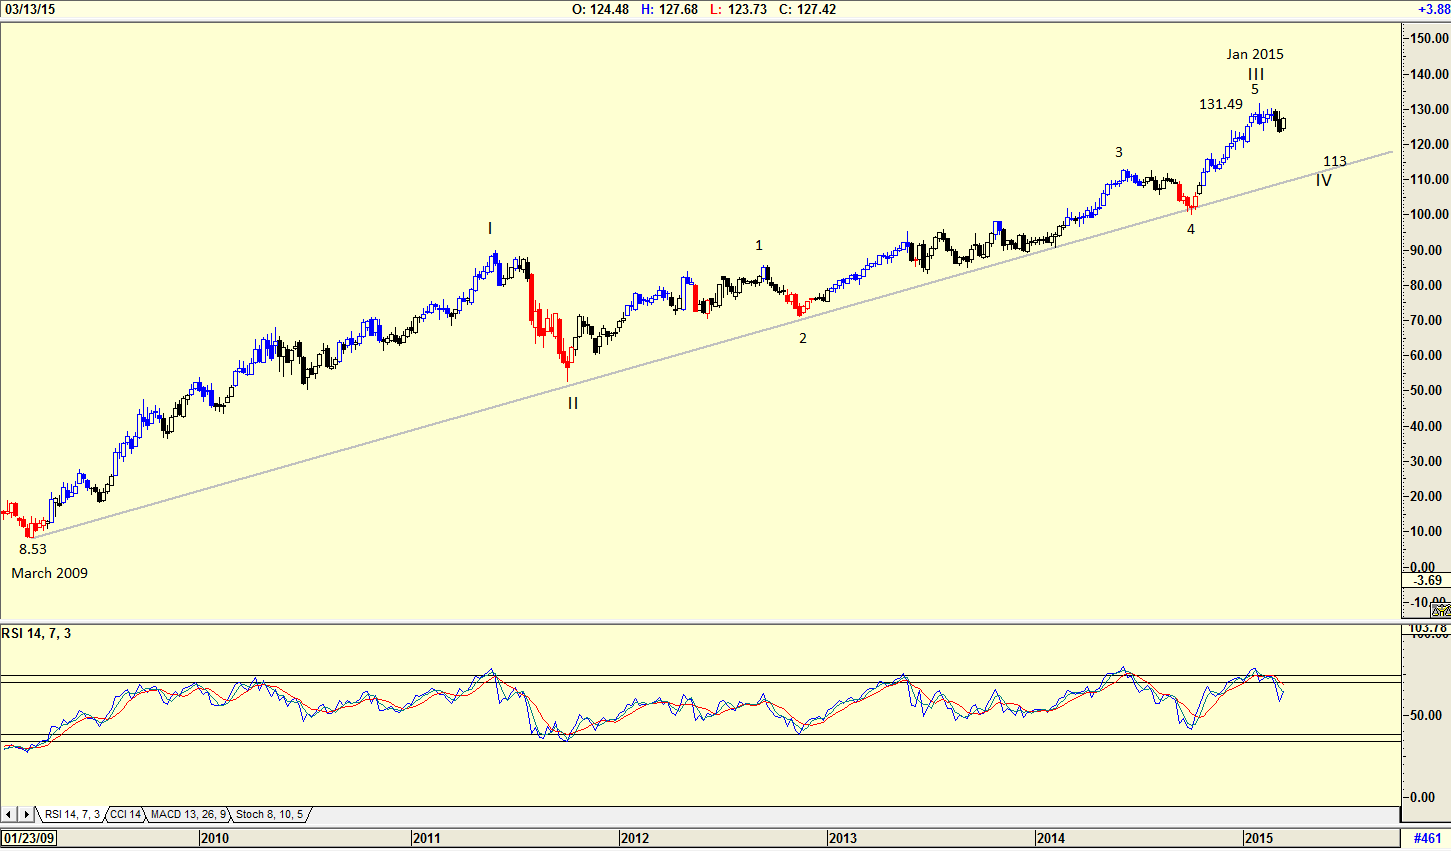
| Figure 2. Weekly chart displaying the Elliott Wave count. |
| Graphic provided by: AdvancedGET. |
| |
| The chart in Figure 2 is a weekly chart showing how the share price has risen from a low of $8.53 in March 2009 to its high of $131.49 by January 2015. The chart shows an Elliott Wave count suggesting that the share price is tracing a wave IV correction. The support line on the chart is suggesting a target in the region of $113. The RSI is suggesting a sell. |

|
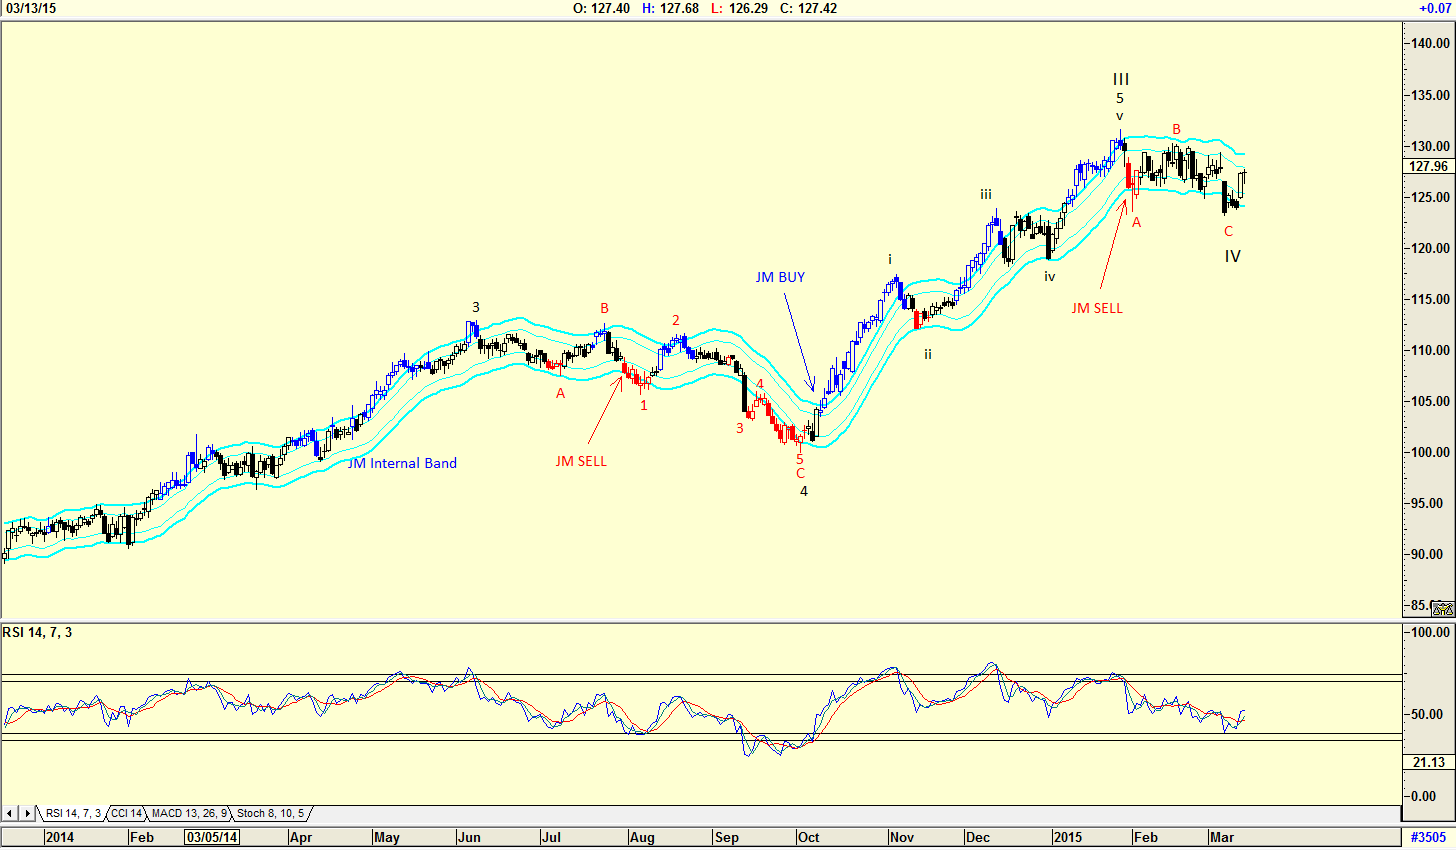
| Figure 3. Daily chart with JM Internal Band indicator |
| Graphic provided by: AdvancedGET. |
| |
| The chart in Figure 3 is a daily chart with an Elliott Wave count suggesting that the share price could be completing a WAVE IV count. However, although the RSI is trending down and is close to the 32 horizontal line, has not given a buy signal, suggesting that WAVE IV could still drop further. The JM Internal Band has not suggested a buy. The JM Internal Band is a 15-period simple moving average offset by 2% positive and 2% negative. A move above the upper band suggests a buy and a move below the lower band a sell. Because a realty trust is usually a conservative investment, its attraction being the yield paid, a conservative investor would find it preferable to wait for a buy signal triggered by the JM Internal Band indicator. |
Has been a technical analyst since 1969, and has worked as a futures and options trader with First Financial Futures in Johannesburg, South Africa.
| Address: | 3256 West 24th Ave |
| Vancouver, BC | |
| Phone # for sales: | 6042634214 |
| E-mail address: | petroosp@gmail.com |
Click here for more information about our publications!
PRINT THIS ARTICLE

Request Information From Our Sponsors
- StockCharts.com, Inc.
- Candle Patterns
- Candlestick Charting Explained
- Intermarket Technical Analysis
- John Murphy on Chart Analysis
- John Murphy's Chart Pattern Recognition
- John Murphy's Market Message
- MurphyExplainsMarketAnalysis-Intermarket Analysis
- MurphyExplainsMarketAnalysis-Visual Analysis
- StockCharts.com
- Technical Analysis of the Financial Markets
- The Visual Investor
- VectorVest, Inc.
- Executive Premier Workshop
- One-Day Options Course
- OptionsPro
- Retirement Income Workshop
- Sure-Fire Trading Systems (VectorVest, Inc.)
- Trading as a Business Workshop
- VectorVest 7 EOD
- VectorVest 7 RealTime/IntraDay
- VectorVest AutoTester
- VectorVest Educational Services
- VectorVest OnLine
- VectorVest Options Analyzer
- VectorVest ProGraphics v6.0
- VectorVest ProTrader 7
- VectorVest RealTime Derby Tool
- VectorVest Simulator
- VectorVest Variator
- VectorVest Watchdog
