

HOT TOPICS LIST
- MACD
- Fibonacci
- RSI
- Gann
- ADXR
- Stochastics
- Volume
- Triangles
- Futures
- Cycles
- Volatility
- ZIGZAG
- MESA
- Retracement
- Aroon
INDICATORS LIST
LIST OF TOPICS
PRINT THIS ARTICLE
by Donald W. Pendergast, Jr.
Shares of Apple, Inc. are still in corrective mode, per its key weekly price cycles.
Position: N/A
Donald W. Pendergast, Jr.
Freelance financial markets writer and online publisher of the Trendzetterz.com S&P 500 Weekly Forecast service.
PRINT THIS ARTICLE
AAPL: Weekly Cycles Say More Downside Possible
03/18/15 04:56:50 PMby Donald W. Pendergast, Jr.
Shares of Apple, Inc. are still in corrective mode, per its key weekly price cycles.
Position: N/A
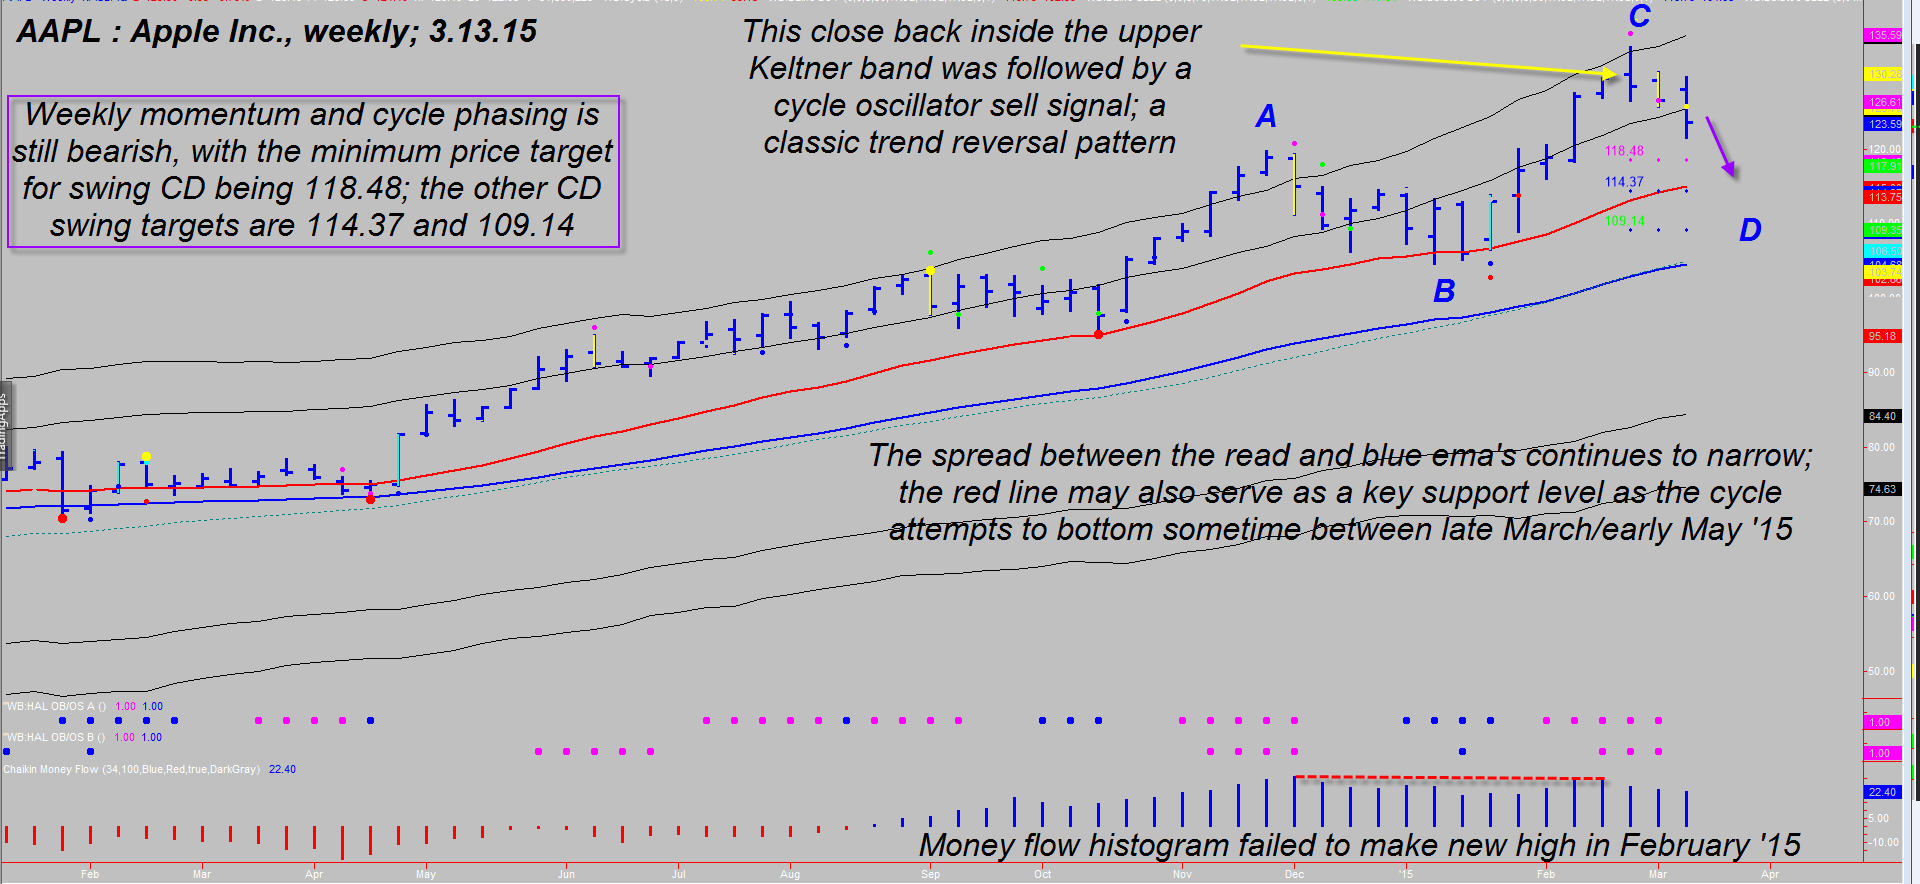
| Apple, Inc. shares (AAPL) are moving lower in a measured, proportional correction against its primary uptrend and still have room to travel lower before meaningful demand zones are likely to cause a tradable cycle bottom to form. Here's a closer look now (Figure 1). |
|
| Figure 1. Apple, Inc. (AAPL): A minimum of a $5 per share decline is needed before the minimum swing CD price target of $118.48 is achieved by this mega-cap issue. |
| Graphic provided by: TradeStation. |
| Graphic provided by: ProfitTrader7 from www.walterbressert.com. |
| |
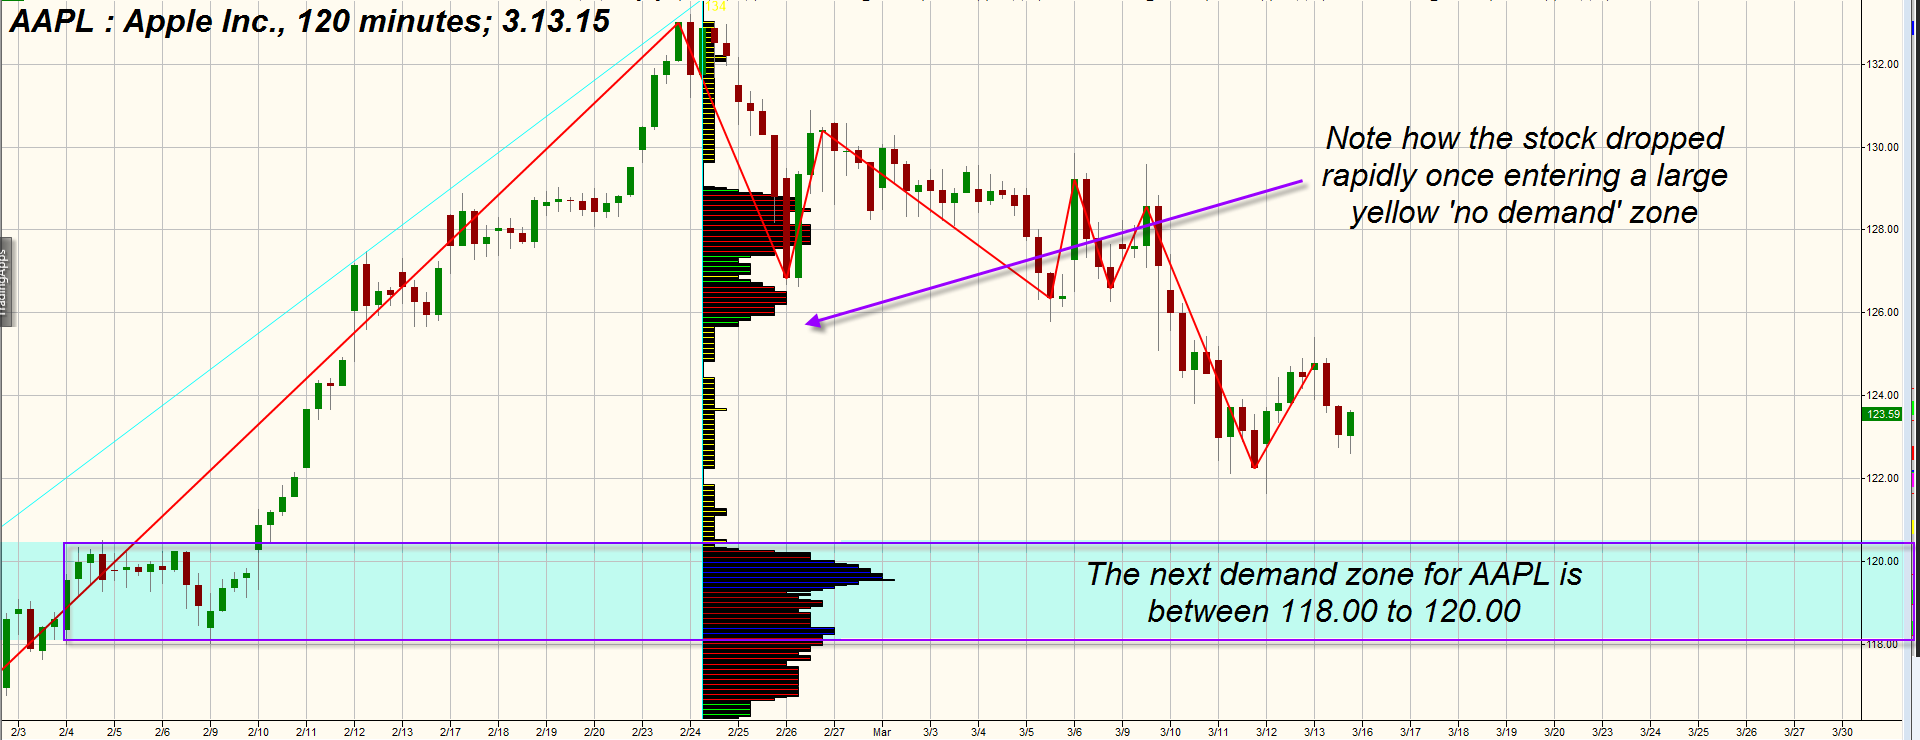
| AAPL is a hugely popular stock with a wide variety of market participants — from day to swing to long-term trend traders. The stock has such huge capitalization that it trades more like an index than a typical large/mega cap stock does and that makes for easier forecasting, timing, and potential profit opportunities on a regular basis. AAPL's weekly trading cycle averages 18 bars (trough to trough basis) and the most recent cycle high occurred the week ending February 27, 2015. It topped out right on schedule, and as such the current 18-week cycle has to be considered to be of the "bearish" variety. This means that depending on how things play out over the next couple of months in the markets, AAPL may not bottom out until early April to mid-May 2015. If the selling pressure remains modest however, the stock's more bullish cycle low forecast suggests that late March to early April 2015 is a more probable bottoming time window for AAPL. Here are some key technicals that suggest that a decline to 118.00-120.00 is highly probable over the next two to five weeks: 1. The minimum swing CD Fibonacci price targets are 118.48, 114.37, and 109.14 respectively, which suggests at least another $5.00 decline until the minimum pattern target is reached. 2. The 120-minute trend profile chart reveals that there is virtually no demand for AAPL until it hits 120.00, with another small demand zone down near 118.00. 3. The Chaikin money flow histogram (CMF)(34) failed to reach a new high along with price in February 2015; this, combined with the close back inside the upper Keltner band and then a subsequent weekly cycle oscillator sell signal set up the possibility that a major bearish trend reversal was at hand. 4. The spread between the key red and blue exponential moving averages (EMA) continues to narrow, something always present as a trend reversal develops. 5. Should AAPL fail to hold 118.00 and a confirmed cycle low and bullish reversal fail occur within a week after hitting the lower end of the 118.00-120.00 demand zone, then the door is wide open for a literal plunge in the stock to the next heavy demand zone, which spans the range between 109.00 to 113.50 (Figure 2). This is something all APPL traders and investors need to watch — to see if the 118.00 level can manage a true weekly reversal of the current downswing or not. |
|
| Figure 2. Heavy Demand Zone. AAPL dropped quickly once it entered the yellow "no demand" trend profile zone; the next blue "demand" zone stretches from 118.00 to 120.00. The next demand zone is far beneath — between 109.00 and 113.50. |
| Graphic provided by: Trend Profile from www.trading-algo.com. |
| |
| There has been a lot of trader talk of late about what AAPL's long-term fortunes may be once it replaces AT&T (T) in the Dow Jones Industrial Average in the near future; some statisticians maintain that most stocks added to the mighty Dow 30 index go on to underperform the S&P 500 index (.SPX, SPY) for many years. Only time will tell how AAPL will fare, but for savvy traders who master the art of trading with cycles, it really doesn't make any difference which way AAPL goes because there is always a way to potentially profit from this stock in bull or bear phases. Trade wisely until we meet here again. |
Freelance financial markets writer and online publisher of the Trendzetterz.com S&P 500 Weekly Forecast service.
| Title: | Market consultant and writer |
| Company: | Trendzetterz |
| Address: | 81 Hickory Hollow Drive |
| Crossville, TN 38555 | |
| Phone # for sales: | 904-303-4814 |
| Website: | trendzetterz.com |
| E-mail address: | support@trendzetterz.com |
Traders' Resource Links | |
| Trendzetterz has not added any product or service information to TRADERS' RESOURCE. | |
Click here for more information about our publications!
Comments

Request Information From Our Sponsors
- StockCharts.com, Inc.
- Candle Patterns
- Candlestick Charting Explained
- Intermarket Technical Analysis
- John Murphy on Chart Analysis
- John Murphy's Chart Pattern Recognition
- John Murphy's Market Message
- MurphyExplainsMarketAnalysis-Intermarket Analysis
- MurphyExplainsMarketAnalysis-Visual Analysis
- StockCharts.com
- Technical Analysis of the Financial Markets
- The Visual Investor
- VectorVest, Inc.
- Executive Premier Workshop
- One-Day Options Course
- OptionsPro
- Retirement Income Workshop
- Sure-Fire Trading Systems (VectorVest, Inc.)
- Trading as a Business Workshop
- VectorVest 7 EOD
- VectorVest 7 RealTime/IntraDay
- VectorVest AutoTester
- VectorVest Educational Services
- VectorVest OnLine
- VectorVest Options Analyzer
- VectorVest ProGraphics v6.0
- VectorVest ProTrader 7
- VectorVest RealTime Derby Tool
- VectorVest Simulator
- VectorVest Variator
- VectorVest Watchdog