HOT TOPICS LIST
- MACD
- Fibonacci
- RSI
- Gann
- ADXR
- Stochastics
- Volume
- Triangles
- Futures
- Cycles
- Volatility
- ZIGZAG
- MESA
- Retracement
- Aroon
INDICATORS LIST
LIST OF TOPICS
PRINT THIS ARTICLE
by Koos van der Merwe
With the price of gold having dropped as much as it did over the past year, to what extent were mines affected and is it time to buy back into them?
Position: Hold
Koos van der Merwe
Has been a technical analyst since 1969, and has worked as a futures and options trader with First Financial Futures in Johannesburg, South Africa.
PRINT THIS ARTICLE
ELLIOTT WAVE
Agnico-Eagle Mines
03/11/15 04:28:18 PMby Koos van der Merwe
With the price of gold having dropped as much as it did over the past year, to what extent were mines affected and is it time to buy back into them?
Position: Hold
| With the price of gold falling as much as it has over the past year, many of the mining stocks fell as well. Is it time to start buying mining stocks once again? Agnico-Eagle Mines (AEM), is a Canadian-based gold producer with operations in Canada, Finland, and Mexico with exploration and development activities extending into the United States. The company has full exposure to higher gold prices with its policy of no-forward gold sales. |

|
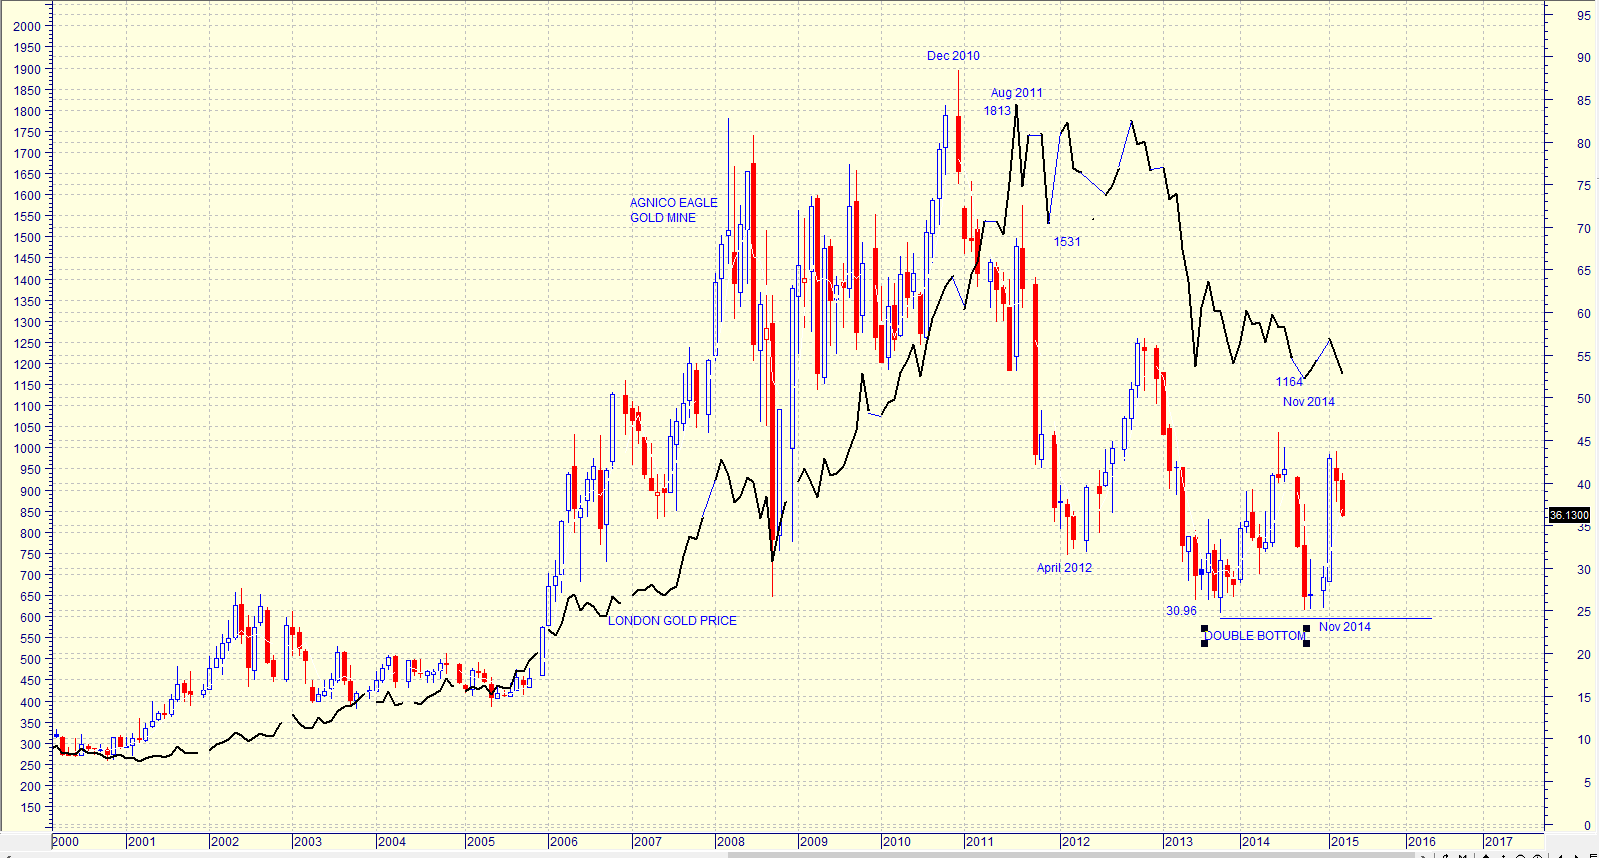
| Figure 1. Monthly Chart Of Agnico Eagle Mines (AEM) With London Gold Price Superimposed. Until December 2010 the stock price of AEM tracked the price of gold but after that the stock price started to fall. |
| Graphic provided by: MetaStock. |
| |
| The chart in Figure 1 shows a monthly chart of AEM with the London gold price superimposed on it. Note how the share price of the mine tracked the price of gold but in December 2010 the price started to fall in anticipation of a fall in the London gold price in August 2011. With the London gold price bottoming at 1164 in November 2014, AEM made a double bottom at $30.96. The formation of a double bottom is a strong suggestion that the share price will rise. With the London gold price testing the $1164 per oz. level, and the double bottom made by AEM, the chart could be suggesting a recovery in the gold price, especially seeing that the share price of the mine previously anticipated the move in the gold price as shown on the chart. |

|
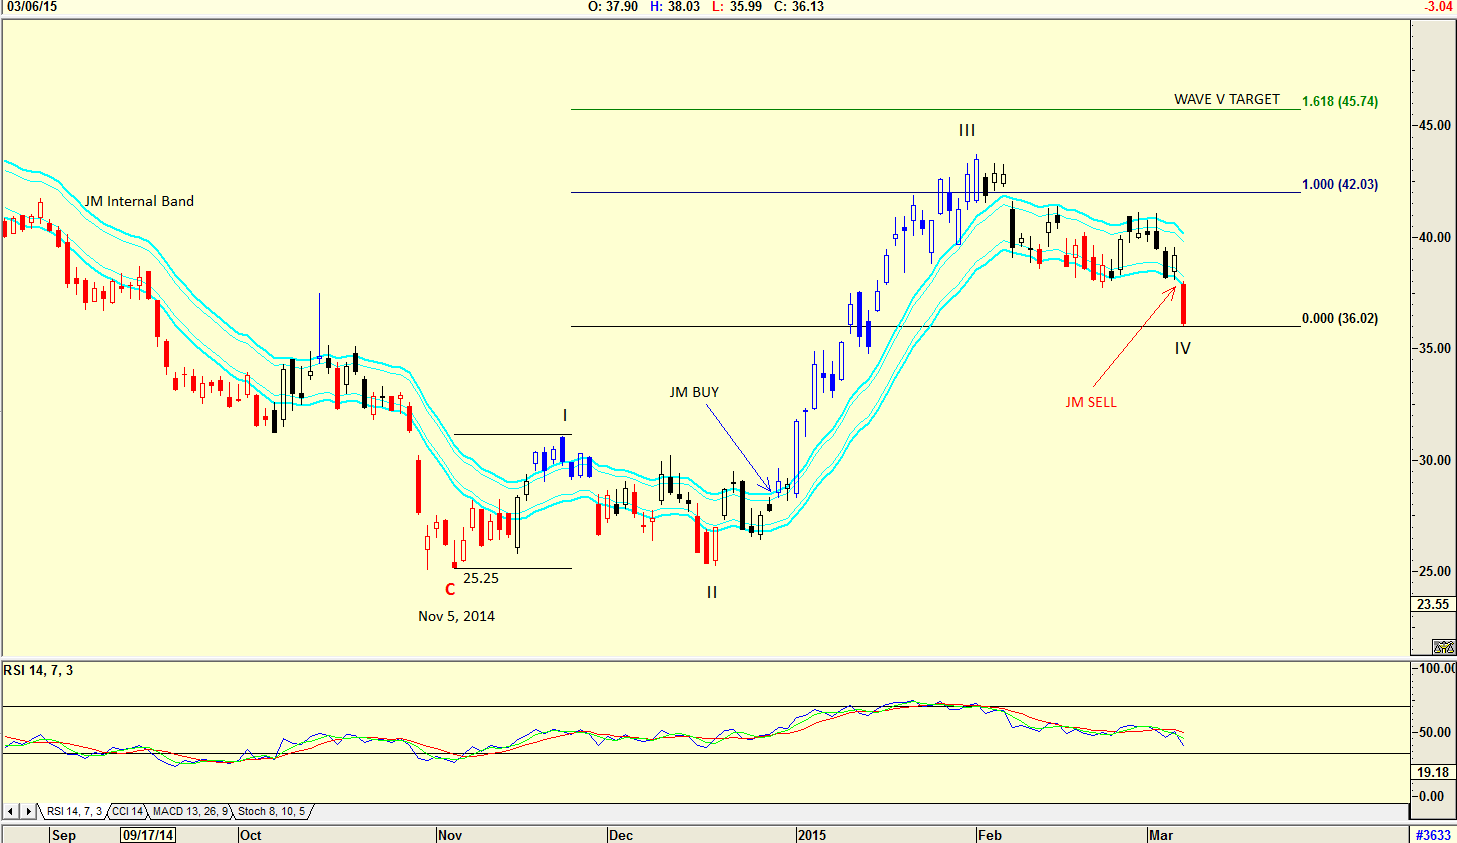
| Figure 2. Daily Chart With Elliott Wave Count. The share price bottomed on November 5, 2014. From that level the price rose in an Elliott wave count suggesting that it is completing a WAVE IV and could start rising in a WAVE V. |
| Graphic provided by: AdvancedGET. |
| |
| The chart in Figure 2 is a daily chart of AEM suggesting that the share price bottomed on November 5, 2014 at $25.25. From that level the share price rose in an Elliott wave count suggesting that it is completing a WAVE IV and could start rising in a WAVE V. Should the WAVE IV bottom at $36.02 truly be the bottom, then the share price should rise in the WAVE V to the suggested target of $45.74, a 1.618 Fibonacci projection of the length of WAVE I. However, note the relative strength index (RSI) which is suggesting that the share price could fall further. The chart also shows the JM internal band. The JM internal band is a 15-period simple moving average offset by 2% positive and 2% negative. A move above the upper band suggests a buy and below the lower band a sell. The chart shows that a sell signal was triggered on March 6, 2015. |
| I would not be a buyer of the share at present levels. Should the share price fall further as suggested, then I would recalculate the target from the new low that forms. I would also watch the RSI waiting for it to suggest a buy. An investor, however, would wait for a new buy signal when the share price breaks above the upper JM internal band. |
Has been a technical analyst since 1969, and has worked as a futures and options trader with First Financial Futures in Johannesburg, South Africa.
| Address: | 3256 West 24th Ave |
| Vancouver, BC | |
| Phone # for sales: | 6042634214 |
| E-mail address: | petroosp@gmail.com |
Click here for more information about our publications!
PRINT THIS ARTICLE

Request Information From Our Sponsors
- StockCharts.com, Inc.
- Candle Patterns
- Candlestick Charting Explained
- Intermarket Technical Analysis
- John Murphy on Chart Analysis
- John Murphy's Chart Pattern Recognition
- John Murphy's Market Message
- MurphyExplainsMarketAnalysis-Intermarket Analysis
- MurphyExplainsMarketAnalysis-Visual Analysis
- StockCharts.com
- Technical Analysis of the Financial Markets
- The Visual Investor
- VectorVest, Inc.
- Executive Premier Workshop
- One-Day Options Course
- OptionsPro
- Retirement Income Workshop
- Sure-Fire Trading Systems (VectorVest, Inc.)
- Trading as a Business Workshop
- VectorVest 7 EOD
- VectorVest 7 RealTime/IntraDay
- VectorVest AutoTester
- VectorVest Educational Services
- VectorVest OnLine
- VectorVest Options Analyzer
- VectorVest ProGraphics v6.0
- VectorVest ProTrader 7
- VectorVest RealTime Derby Tool
- VectorVest Simulator
- VectorVest Variator
- VectorVest Watchdog
