HOT TOPICS LIST
- MACD
- Fibonacci
- RSI
- Gann
- ADXR
- Stochastics
- Volume
- Triangles
- Futures
- Cycles
- Volatility
- ZIGZAG
- MESA
- Retracement
- Aroon
INDICATORS LIST
LIST OF TOPICS
PRINT THIS ARTICLE
by Donald W. Pendergast, Jr.
After enjoying a 33% rally in late 2014/early 2015, shares of Omnicare, Inc. are moving lower as its dominant cycles turn bearish.
Position: N/A
Donald W. Pendergast, Jr.
Freelance financial markets writer and online publisher of the Trendzetterz.com S&P 500 Weekly Forecast service.
PRINT THIS ARTICLE
CYCLES
OCR: Major Cycle High In Place
03/11/15 04:23:56 PMby Donald W. Pendergast, Jr.
After enjoying a 33% rally in late 2014/early 2015, shares of Omnicare, Inc. are moving lower as its dominant cycles turn bearish.
Position: N/A
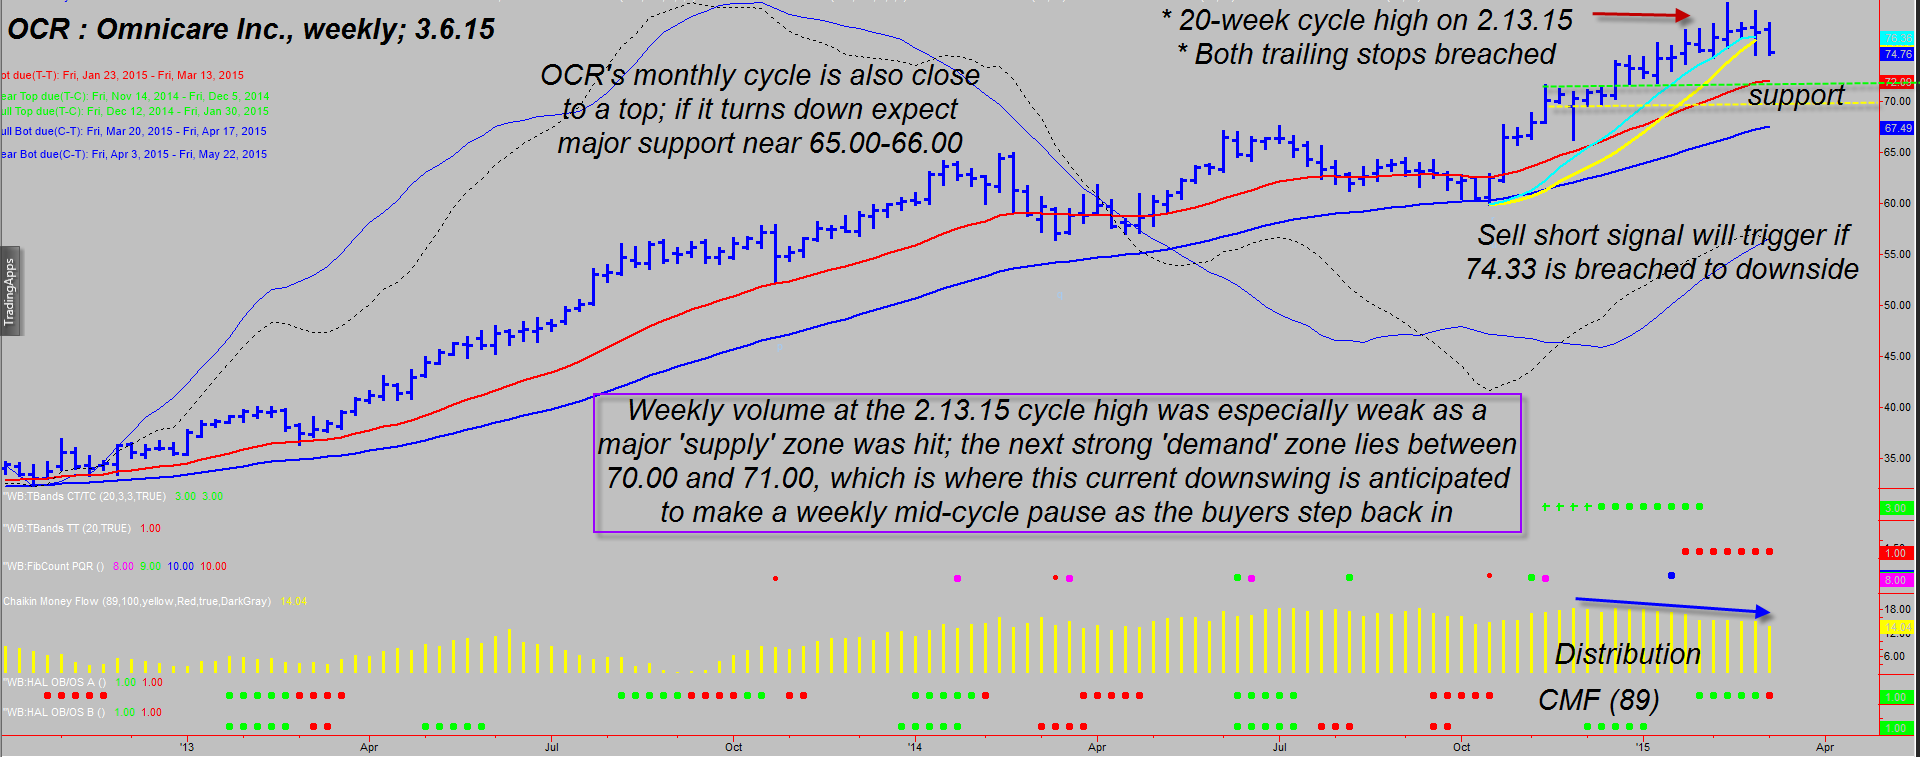
| Traders who master the art of cycles analysis can often be blessed with advance knowledge of where key time/price reversal and trend continuation opportunities will occur; the significant weekly cycle high pattern now evident in Omnicare, Inc. (OCR) shares was able to be forecasted with a high degree of confidence — weeks before it peaked in February 2015. Similarly, its current decline from that cycle high also has a high probability time/price zone where it should bottom in a key demand zone sometime during April 2015. Here's a closer look at this developing short trading setup (Figure 1). |

|
| Figure 1. Omnicare Inc. (OCR): With its 20-week cycle high already confirmed (February 13, 2015), a drop beneath 74.33 could trigger a sustained move down to the stock's next demand zone between 70.00 and 71.00. |
| Graphic provided by: TradeStation. |
| Graphic provided by: ProfitTrader7 from www.walterbressert.com. |
| |
| Based on twenty years of historical data, OCR's dominant weekly cycle (trough to trough) averages 20 bars in length; it's most recent cycle low (prior to its 33% late 2014/early 2015 rally) was made the week ending (W/E) October 17, 2014 and the ultimate peak of the cycle was achieved the W/E February 13, 2015. The current cycle is longer than the average, as is often the case in a powerful trending situation, but we can still derive plenty of useful info by looking at key elements of OCR's weekly and monthly (not shown) charts: 1. The weekly chart has just fired two cycle oscillator sell signals. 2. Trading volume has been heavy for two weeks in succession now. 3. The monthly chart reveals low volume for February as a new high was made — this is a major clue that a key supply zone is between 79.50 - 81.00. The monthly chart price bars are well above their extreme upper Keltner band, which is yet another high probability warning of a major high, given all of the other technicals at work here. 4. A similar volume exhaustion signal fired on the weekly chart just prior to the cycle high of February 13, 2015. 5. The Chaikin money flow (CMF)(89) histogram reveals that the smart money are distributing at least some of their shares to retail traders. 6. Weekly moving average momentum (the spread between the two) is now narrowing, which is bearish. 7. There is no significant demand area on OCR's weekly chart until 70.00-71.00, while its monthly chart shows a major demand zone between 65.00 and 66.00. 8. The algorithm that calculates the cycles forecast for this stock now suggests that there is a 70% probability that OCR will bottom sometime between late March 2015 and mid-April 2015; it also suggests that OCR has a 30% chance of bottoming even later, perhaps as far out as May 22, 2015. 9. OCR's monthly cycle averages 16 bars and is now in its eleventh month; if the February bar was the monthly high, then we can expect the stock to decline for one to three months more, depending on how well the previously mentioned demand zones work to bring the buyers back in for a bullish bounce. 10. Both of the weekly chart cycles-based trailing stops have been breached to the downside. |

|
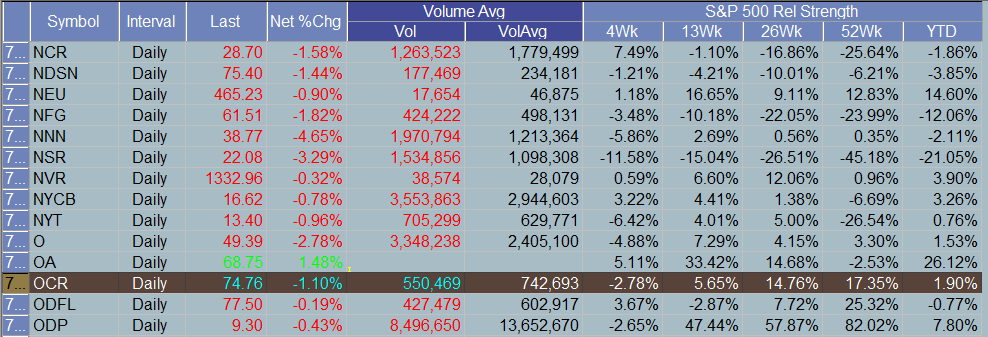
| Figure 2. Relative Performance. OCR is still outperforming the S&P 500 index (.SPX, SPY) over various time periods, but has definitely begun to underperform it during the past four weeks. |
| Graphic provided by: TradeStation. |
| Graphic provided by: TradeStation 9.1 RadarScreen. |
| |
| Enterprising bears should watch to see if the February low of 74.33 is taken out; if so, that's your ticket for a new short sale entry occurring after a confirmed 20-week cycle high. You'll need to manage the trade wisely and perhaps even wait for a bit of a pullback to enter at a better price after the weekly bar triggers the entry, but this looks to be a low-risk, good reward trade setup from many technical angles. Keep your account risk at 1-2% max and remember to trade wisely until we meet here again. |
Freelance financial markets writer and online publisher of the Trendzetterz.com S&P 500 Weekly Forecast service.
| Title: | Market consultant and writer |
| Company: | Trendzetterz |
| Address: | 81 Hickory Hollow Drive |
| Crossville, TN 38555 | |
| Phone # for sales: | 904-303-4814 |
| Website: | trendzetterz.com |
| E-mail address: | support@trendzetterz.com |
Traders' Resource Links | |
| Trendzetterz has not added any product or service information to TRADERS' RESOURCE. | |
Click here for more information about our publications!
PRINT THIS ARTICLE

Request Information From Our Sponsors
- StockCharts.com, Inc.
- Candle Patterns
- Candlestick Charting Explained
- Intermarket Technical Analysis
- John Murphy on Chart Analysis
- John Murphy's Chart Pattern Recognition
- John Murphy's Market Message
- MurphyExplainsMarketAnalysis-Intermarket Analysis
- MurphyExplainsMarketAnalysis-Visual Analysis
- StockCharts.com
- Technical Analysis of the Financial Markets
- The Visual Investor
- VectorVest, Inc.
- Executive Premier Workshop
- One-Day Options Course
- OptionsPro
- Retirement Income Workshop
- Sure-Fire Trading Systems (VectorVest, Inc.)
- Trading as a Business Workshop
- VectorVest 7 EOD
- VectorVest 7 RealTime/IntraDay
- VectorVest AutoTester
- VectorVest Educational Services
- VectorVest OnLine
- VectorVest Options Analyzer
- VectorVest ProGraphics v6.0
- VectorVest ProTrader 7
- VectorVest RealTime Derby Tool
- VectorVest Simulator
- VectorVest Variator
- VectorVest Watchdog
