

HOT TOPICS LIST
- MACD
- Fibonacci
- RSI
- Gann
- ADXR
- Stochastics
- Volume
- Triangles
- Futures
- Cycles
- Volatility
- ZIGZAG
- MESA
- Retracement
- Aroon
INDICATORS LIST
LIST OF TOPICS
PRINT THIS ARTICLE
by Adam Ryan
As the price of crude oil is steadily declining you will hear pundits come up with numerous reasons for the decline. Some have merit, but the majority fail to truly understand why the bears are out in full force.
Position: N/A
Adam Ryan
President and founder of Optic Trading. Optic Trading is an educational course built upon the principals of one-on-one support, coaching, examples, and tangible honest advice.
PRINT THIS ARTICLE
TECHNICAL ANALYSIS
The Real Reason Crude Oil Is Dropping
03/04/15 04:02:55 PMby Adam Ryan
As the price of crude oil is steadily declining you will hear pundits come up with numerous reasons for the decline. Some have merit, but the majority fail to truly understand why the bears are out in full force.
Position: N/A
| It is easy to speculate as to why this move or that move has occurred, but it's not enough to accurately make investment or trading decisions. In order to truly understand what is taking place in the markets it will take much more than relying only on the fundamentals. Markets are made up of human decision making, and humans suffer from two very predictable emotions, fear and greed. These emotions are exploited by the astute investor every day, in every market. I want to level the playing field, and shift the power from the select traders in the "know" to retail traders aspiring to turn pro. Technical Analysis or Fundamental Analysis Technical analysis provides better data for trading and investment decisions, but that is not to say fundamentals do not play a role, the fundamentals are important as well. What I am suggesting is that if you combined both methods and take a top down approach to viewing the markets you will be much better off than relying only on one or the other. In the chart below I have illustrated how I use technical analysis, combined with the fundamentals, to arrive at a logical conclusion as to what is driving the price of crude oil. |
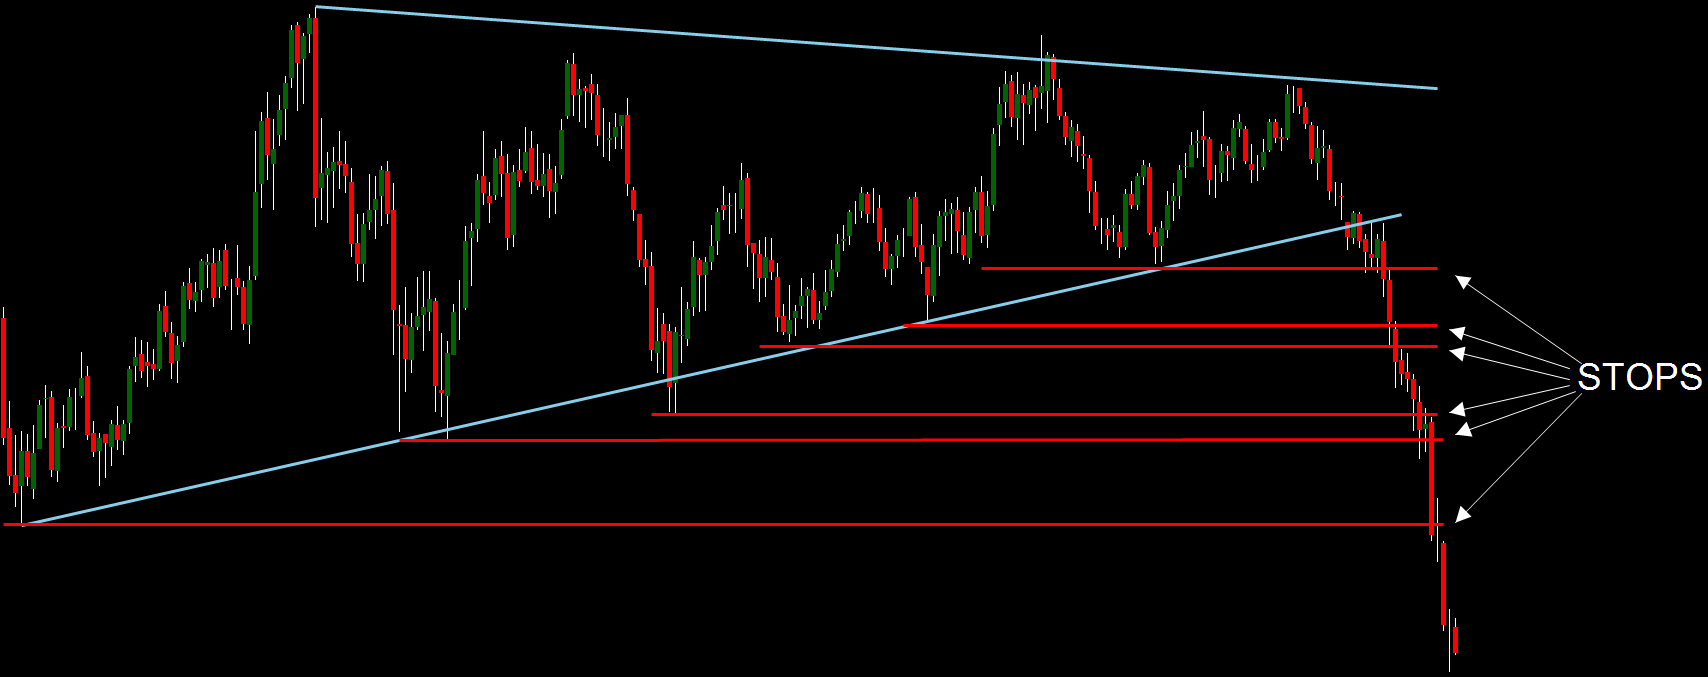
| Understanding What Causes Chart Patterns Crude oil has been in a consolidated range since early 2011 until the breakdown in late 2014. Markets are more likely to stay range bound until a fundamental factor acts as a catalyst for market movement. The technicians of the world would easily be able to look at this chart and tell you we have a triangle pattern that has been broken to the downside. But why? It is not enough to just know what a technical pattern is; you must know what causes this pattern. What is going on in the minds of the people you are competing against? If you can get inside the minds of your competitors you will be two steps ahead, and market movement will no longer appear to be random. Let us dive into the chart in Figure 1, and understand the thinking and rational of our competitors. Imagine you are holding a spring between your thumb and first finger, and you squeeze your fingers together until they are touching. Eventually one of your fingers will have to give, and the spring will launch in the direction it gets released. This pattern is similar to that example. As market movement becomes narrower and narrower it is likely that buyers and sellers are placing their stops above and below swing highs and swing lows. Then there is a sudden move that takes out one of these swings and like the domino effect, the market triggers an explosive move executing all these stops. The red lines on the chart show the most common places for traders to put their stops (There is much more to finding stops than identifying swing highs or lows, but that is beyond the scope of this article). The first set of stops cause a move great enough to trigger the next level of stops and those stops trigger the next level and this can be very explosive. Professional traders know this and they will be selling when everyone else is losing their shirts. It is this panic combined with new smart money entering the market that causes an uncontrollable drop in the price. |
|
| Graphic provided by: NinjaTrader. |
| |
| The Thinking of the Competition Now what is going on in the minds of our competitors? Fear and greed are definitely playing a key role. As stops are being executed traders become fearful and exit positions causing a sharp thrust down, but all traders do not exit just yet. Some greedy traders hold on to their position thinking the market will come back, and when the price gets to the next level there is enough force behind it that it slices right through the level. At this point the greedy traders are beginning to sweat -- the fear of loss sets in and they begin to liquidate their position. When they begin to sell, combined with the stops being executed and new money stepping in, that is when the market really starts to accelerate. Now combine that with OPEC deciding not to cut production (which is a fundamental factor driving market movement) as well as the technicals, and that is the recipe for explosive price discovery. There is much more to successful trading and investing than just learning chart patterns or using fundamental analysis. This is only one of the many situations where we can understand what is "inside the heads" of our competitors. This is also why I teach my student to understand the "why", and not just the "how." While we can never be 100% certain, we can put the probability of success in our favor by understanding how market participants think. |
President and founder of Optic Trading. Optic Trading is an educational course built upon the principals of one-on-one support, coaching, examples, and tangible honest advice.
| Title: | President |
| Company: | Optic Trading |
| Website: | optictrading.com |
| E-mail address: | adam.ryan@optictrading.com |
Traders' Resource Links | |
| Optic Trading has not added any product or service information to TRADERS' RESOURCE. | |
Click here for more information about our publications!
Comments

Request Information From Our Sponsors
- StockCharts.com, Inc.
- Candle Patterns
- Candlestick Charting Explained
- Intermarket Technical Analysis
- John Murphy on Chart Analysis
- John Murphy's Chart Pattern Recognition
- John Murphy's Market Message
- MurphyExplainsMarketAnalysis-Intermarket Analysis
- MurphyExplainsMarketAnalysis-Visual Analysis
- StockCharts.com
- Technical Analysis of the Financial Markets
- The Visual Investor
- VectorVest, Inc.
- Executive Premier Workshop
- One-Day Options Course
- OptionsPro
- Retirement Income Workshop
- Sure-Fire Trading Systems (VectorVest, Inc.)
- Trading as a Business Workshop
- VectorVest 7 EOD
- VectorVest 7 RealTime/IntraDay
- VectorVest AutoTester
- VectorVest Educational Services
- VectorVest OnLine
- VectorVest Options Analyzer
- VectorVest ProGraphics v6.0
- VectorVest ProTrader 7
- VectorVest RealTime Derby Tool
- VectorVest Simulator
- VectorVest Variator
- VectorVest Watchdog