HOT TOPICS LIST
- MACD
- Fibonacci
- RSI
- Gann
- ADXR
- Stochastics
- Volume
- Triangles
- Futures
- Cycles
- Volatility
- ZIGZAG
- MESA
- Retracement
- Aroon
INDICATORS LIST
LIST OF TOPICS
PRINT THIS ARTICLE
by Donald W. Pendergast, Jr.
Shares of Verizon Communications are setting up for a high probability swing buy trade that has many technical dynamics working in its favor.
Position: N/A
Donald W. Pendergast, Jr.
Freelance financial markets writer and online publisher of the Trendzetterz.com S&P 500 Weekly Forecast service.
PRINT THIS ARTICLE
CYCLES
VZ: Cycle Swing CD In Process
03/04/15 03:56:55 PMby Donald W. Pendergast, Jr.
Shares of Verizon Communications are setting up for a high probability swing buy trade that has many technical dynamics working in its favor.
Position: N/A
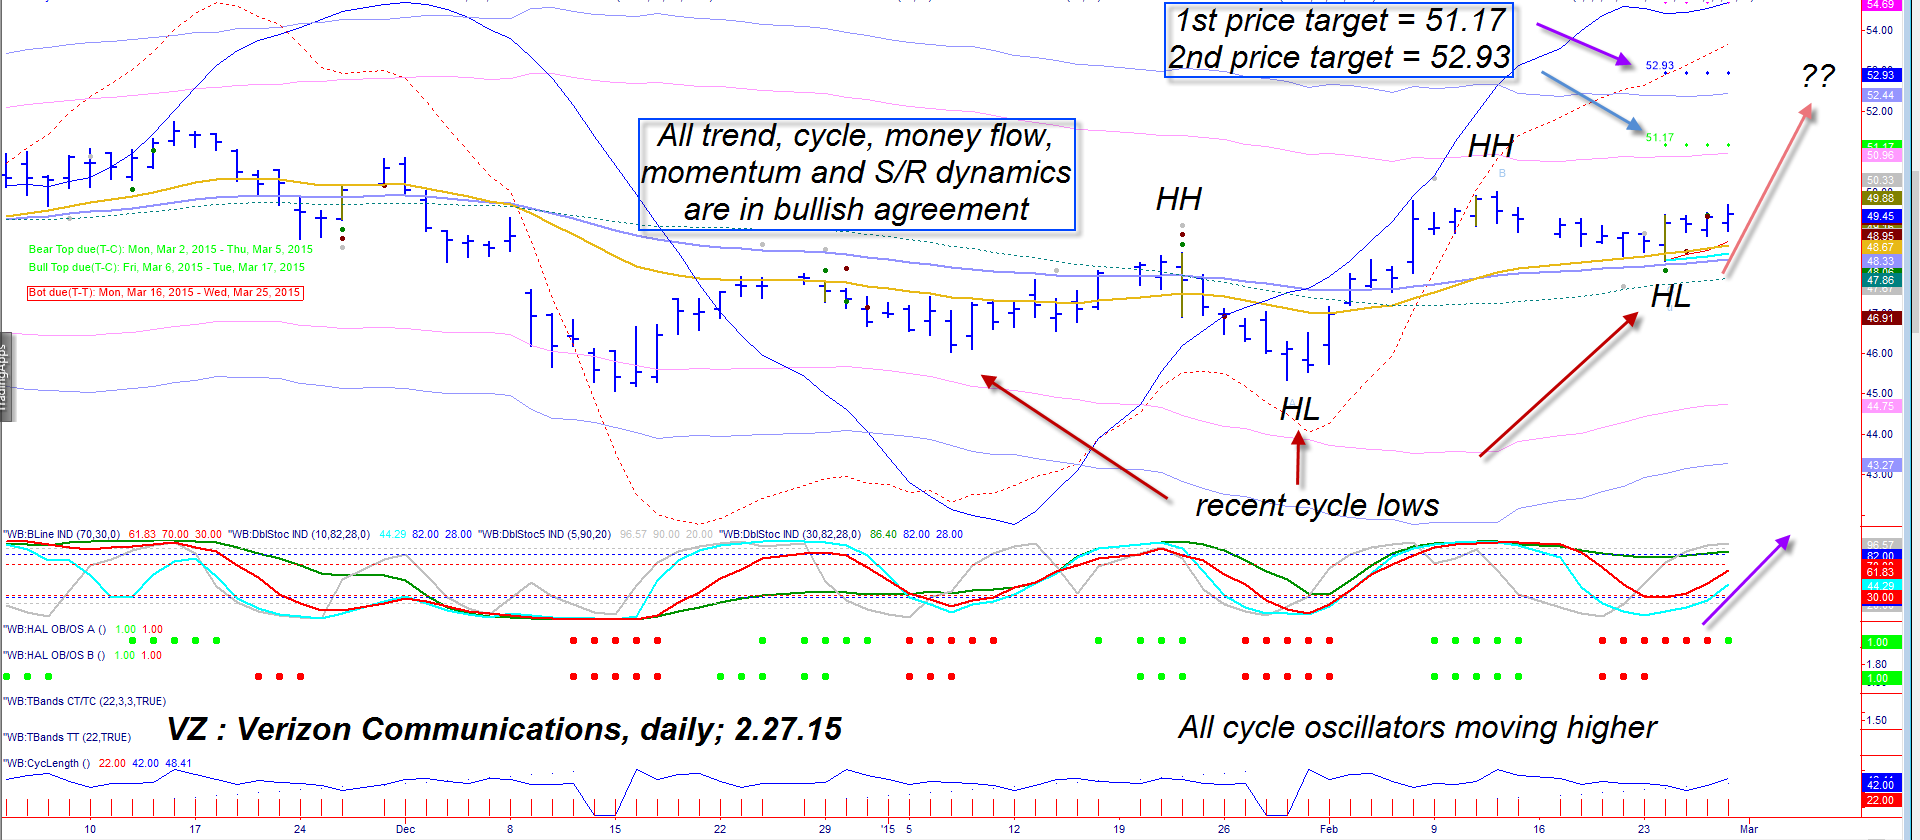
| Price cycle analysis styles range from the mundane to the incredibly complex; for most retail traders, however, the use of basic, tried & true cycles forecasting methods will likely produce satisfactory results. Here's a look at the well-formed, nearly 'textbook quality' swing buy setup now appearing on the daily chart of Verizon Communications (VZ). |

|
| Figure 1. A Buy Setup: A nearly picture-perfect cycles-based swing buy setup has appeared on this stock's daily chart. |
| Graphic provided by: TradeStation. |
| Graphic provided by: ProfitTrader7 from www.walterbressert.com. |
| |
| The dominant daily time frame price cycle for VZ in Figure 1 has averaged 22 bars (trough to trough) over the past 20 years. Since early December 2014, VZ has been making smooth swings that make it easier to confirm valid cycle lows and highs; the cycles are smaller now — about 15-17 bars — but are doing an excellent job of locating solid trade setups. With an uptrend now in force (rising momentum and a series of higher swing highs and higher swing lows) and a fresh cycle low in place as of February 24, 2015, the stage is set for a lovely swing CD entry point: 1. VZ tested exponential moving average (EMA) support lines on the decline into the recent swing low; the Keltner channel mid-line (dashed line) also held. 2. A rise above $49.66 should get the emerging swing the institutional buying firepower needed to move VZ toward its swing price targets of $51.17 and possibly even $52.93. There is even a larger target which is at $54.69; the first two targets are much more likely to be reached, however. 3. Note that the lower price targets each lie just above key Keltner band resistance at $50.96 and $52.44, respectively; the art of taking profits at key support/resistance levels is one of the ways that traders can help improve their performance — by helping them retain more of the open gains accrued before a rally stalls or reverses. So if VZ hits either Keltner band or profit target zone, be sure and take at least partial profits, depending on your trading style. 4. Based on the bullish cyclical and trend dynamics on the chart, VZ currently has a 70% probability of making its next cycle high between March 6, 2015 and March 17, 2015; VZ has a 30% probability of making the cycle high after March 17, 2015. |

|
| Figure 2. Relative Performance. VZ is now beginning to outperform the S&P 500 index over the past four weeks. The stock is also outperforming the index year-to-date (YTD). |
| Graphic provided by: TradeStation. |
| Graphic provided by: TradeStation 9.1 RadarScreen. |
| |
| For swing traders, the use of slightly in-the-money (ITM) calls with two to three months of time value looks like a good choice here — if VZ rises back above $49.66 that is. Running a two to four bar trailing stop of the daily lows is a logical way to manage the trade as is the use of the profit-taking targets previously mentioned. Traders with a slightly more bullish view may also consider setting up near-term covered call trades, also using ITM calls; in this case you would want to sell calls with less than six weeks of time value remaining and you will also need to run a wider trailing stop as compared to the swing trade version of this setup. Keep your account risk at 1-2% maximum for this setup and remember to trade wisely until we meet here again. |
Freelance financial markets writer and online publisher of the Trendzetterz.com S&P 500 Weekly Forecast service.
| Title: | Market consultant and writer |
| Company: | Trendzetterz |
| Address: | 81 Hickory Hollow Drive |
| Crossville, TN 38555 | |
| Phone # for sales: | 904-303-4814 |
| Website: | trendzetterz.com |
| E-mail address: | support@trendzetterz.com |
Traders' Resource Links | |
| Trendzetterz has not added any product or service information to TRADERS' RESOURCE. | |
Click here for more information about our publications!
Comments

Request Information From Our Sponsors
- StockCharts.com, Inc.
- Candle Patterns
- Candlestick Charting Explained
- Intermarket Technical Analysis
- John Murphy on Chart Analysis
- John Murphy's Chart Pattern Recognition
- John Murphy's Market Message
- MurphyExplainsMarketAnalysis-Intermarket Analysis
- MurphyExplainsMarketAnalysis-Visual Analysis
- StockCharts.com
- Technical Analysis of the Financial Markets
- The Visual Investor
- VectorVest, Inc.
- Executive Premier Workshop
- One-Day Options Course
- OptionsPro
- Retirement Income Workshop
- Sure-Fire Trading Systems (VectorVest, Inc.)
- Trading as a Business Workshop
- VectorVest 7 EOD
- VectorVest 7 RealTime/IntraDay
- VectorVest AutoTester
- VectorVest Educational Services
- VectorVest OnLine
- VectorVest Options Analyzer
- VectorVest ProGraphics v6.0
- VectorVest ProTrader 7
- VectorVest RealTime Derby Tool
- VectorVest Simulator
- VectorVest Variator
- VectorVest Watchdog
