

HOT TOPICS LIST
- MACD
- Fibonacci
- RSI
- Gann
- ADXR
- Stochastics
- Volume
- Triangles
- Futures
- Cycles
- Volatility
- ZIGZAG
- MESA
- Retracement
- Aroon
INDICATORS LIST
LIST OF TOPICS
PRINT THIS ARTICLE
by Koos van der Merwe
Considering buying shares in Keurig Green Mountain Coffee? The monthly chart suggests this isn't a good time to buy but the weekly and daily chart suggest that it is a good time to buy. Which chart do you follow?
Position: Buy
Koos van der Merwe
Has been a technical analyst since 1969, and has worked as a futures and options trader with First Financial Futures in Johannesburg, South Africa.
PRINT THIS ARTICLE
ELLIOTT WAVE
A Caffiene Jolt With Green Mountain Coffee
03/03/15 12:19:47 PMby Koos van der Merwe
Considering buying shares in Keurig Green Mountain Coffee? The monthly chart suggests this isn't a good time to buy but the weekly and daily chart suggest that it is a good time to buy. Which chart do you follow?
Position: Buy
| You will often hear analysts give buy recommendations on popular financial media outlets. In fact, I just heard the following report, "Your first trade on Monday, March 2, 2015 is Keurig Green Mountain Coffee." Are they basing their decision on technical analysis or fundamental analysis? I only consider technical analysis, and leave the fundamentals to the Warren Buffetts of this world, so what do the charts tell us? |
|
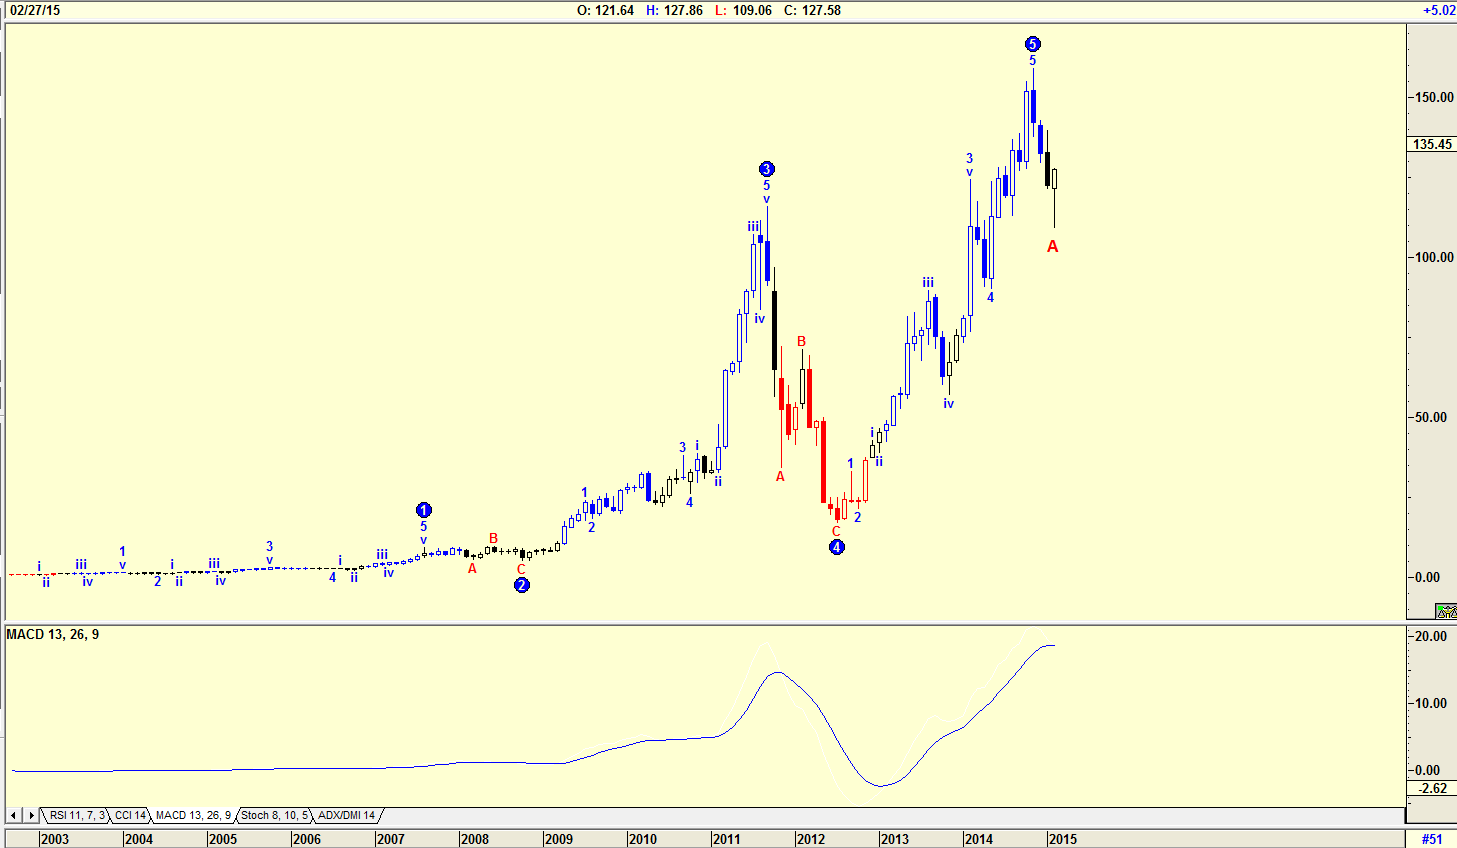
| Figure 1. Monthly Chart Of Keurig Green Mountain Coffee (GMCR). Here you see that a WAVE 5 has completed and the stock price is now in an A-WAVE down. |
| Graphic provided by: AdvancedGET. |
| |
| My chart in Figure 1 is a monthly chart of Keurig Green Mountain Coffee (GMCR), with an Elliott wave count suggesting that the share price has completed a WAVE 5 and is now in an A-WAVE down. The candlestick shown on the chart with a long tail and a short white body is suggesting a reversal could be on the cards. This means that the share price could start moving up in a B-WAVE. The MACD indicator is suggesting a sell signal is in the offing. Buying for the long-term is therefore not on the cards. |
|
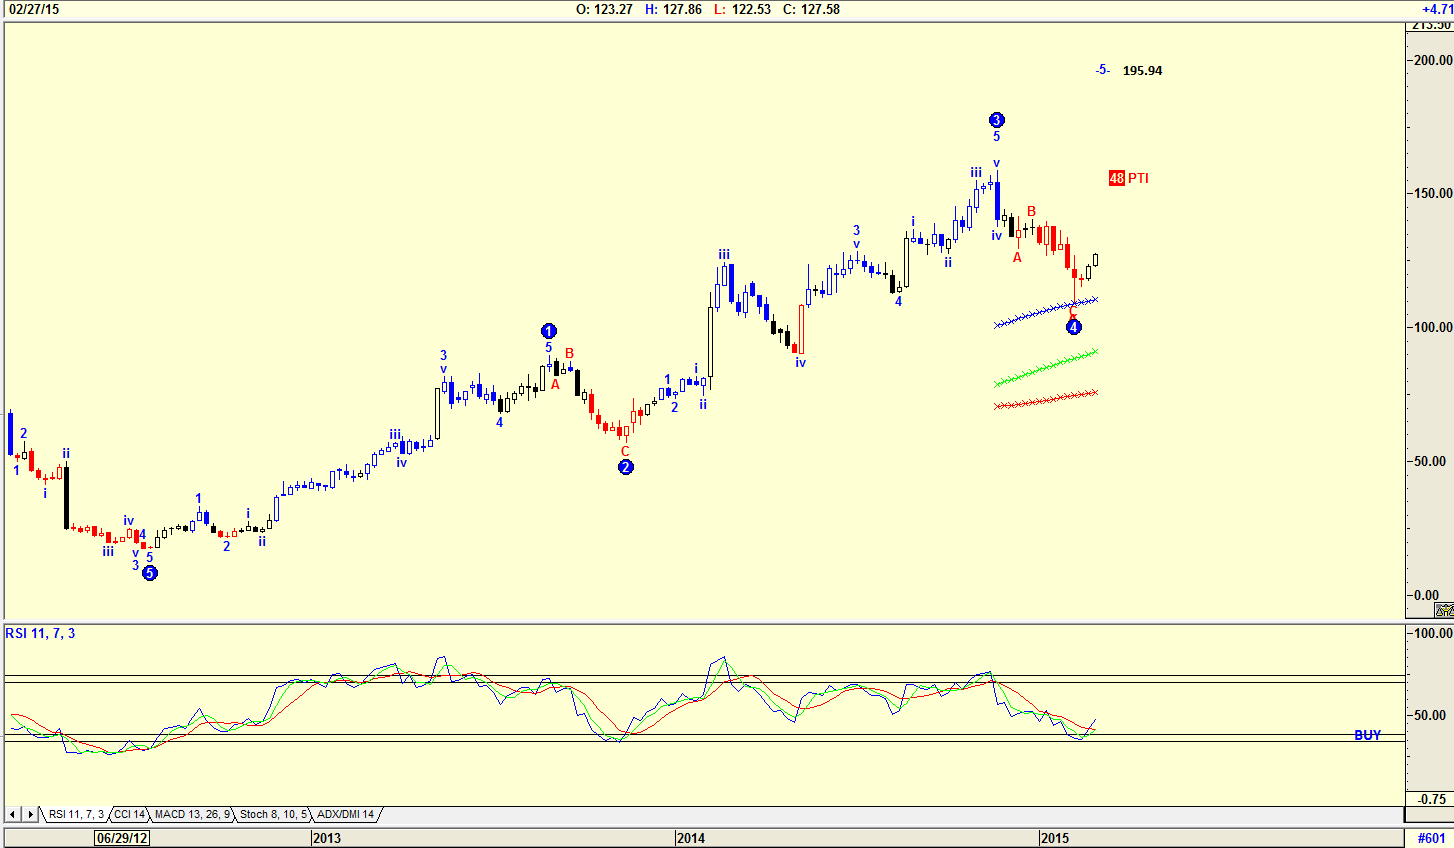
| Figure 2. Weekly Chart of GMCR With Elliott Wave Count. This chart suggests that a WAVE 4 has been completed and the share price is now moving into a WAVE 5. |
| Graphic provided by: AdvancedGET. |
| |
| The chart in Figure 2 is a weekly chart of GMCR showing an Elliott wave count that suggests that a WAVE 4 has been completed, and that the share price is now moving into a WAVE 5 with a target of $195.94. The probability index (PTI) of 48 shown on the chart is average, suggesting that the rise to $195.94 is indeed possible. The relative strength index (RSI) has given a buy suggesting that for the medium-term, the share could be bought. |

|
| Figure 3. Daily Chart With Elliott Wave Count And JM Internal Band. The price of GMCR stock could be in a WAVE 1 of a new bull trend. |
| Graphic provided by: AdvancedGET. |
| |
| The chart in Figure 3 is a daily chart of GMCR with an Elliott wave count suggesting that the share price could be in a WAVE 1 of a new bull trend. The RSI and the ADX(14) indicators are indicating buy signals. However, the DMI is still trending down suggesting weakness ahead. This could suggest that a wave 2 is in the offing. Finally, note the JM Internal Band indicator which gave a buy signal on February 20, 2015. The JM Internal Band is a 15-period simple moving average offset by 2% positive and 2% negative. A move above the upper band is a buy signal, and a move below the lower band, a sell signal. Buying the share at the present price is a risk that could be taken for the short-term. With a wave 2 correction on the horizon, a long-term investor could wait for the correction. |
Has been a technical analyst since 1969, and has worked as a futures and options trader with First Financial Futures in Johannesburg, South Africa.
| Address: | 3256 West 24th Ave |
| Vancouver, BC | |
| Phone # for sales: | 6042634214 |
| E-mail address: | petroosp@gmail.com |
Click here for more information about our publications!
PRINT THIS ARTICLE

Request Information From Our Sponsors
- StockCharts.com, Inc.
- Candle Patterns
- Candlestick Charting Explained
- Intermarket Technical Analysis
- John Murphy on Chart Analysis
- John Murphy's Chart Pattern Recognition
- John Murphy's Market Message
- MurphyExplainsMarketAnalysis-Intermarket Analysis
- MurphyExplainsMarketAnalysis-Visual Analysis
- StockCharts.com
- Technical Analysis of the Financial Markets
- The Visual Investor
- VectorVest, Inc.
- Executive Premier Workshop
- One-Day Options Course
- OptionsPro
- Retirement Income Workshop
- Sure-Fire Trading Systems (VectorVest, Inc.)
- Trading as a Business Workshop
- VectorVest 7 EOD
- VectorVest 7 RealTime/IntraDay
- VectorVest AutoTester
- VectorVest Educational Services
- VectorVest OnLine
- VectorVest Options Analyzer
- VectorVest ProGraphics v6.0
- VectorVest ProTrader 7
- VectorVest RealTime Derby Tool
- VectorVest Simulator
- VectorVest Variator
- VectorVest Watchdog