HOT TOPICS LIST
- MACD
- Fibonacci
- RSI
- Gann
- ADXR
- Stochastics
- Volume
- Triangles
- Futures
- Cycles
- Volatility
- ZIGZAG
- MESA
- Retracement
- Aroon
INDICATORS LIST
LIST OF TOPICS
PRINT THIS ARTICLE
by Matt Blackman
Between the middle of June 2014 and the end of January 2015, the price of a barrel of West Texas Intermediate dropped from $107 to a low of $43.55, a decline of 60%. Is there more downside to come or is the worst over for Texas Tea?
Position: N/A
Matt Blackman
Matt Blackman is a full-time technical and financial writer and trader. He produces corporate and financial newsletters, and assists clients in getting published in the mainstream media. He is the host of TradeSystemGuru.com. Matt has earned the Chartered Market Technician (CMT) designation. Find out what stocks and futures Matt is watching on Twitter at www.twitter.com/RatioTrade
PRINT THIS ARTICLE
MOVING AVERAGES
Is The Slippery Slide Over For Oil?
02/20/15 03:51:40 PMby Matt Blackman
Between the middle of June 2014 and the end of January 2015, the price of a barrel of West Texas Intermediate dropped from $107 to a low of $43.55, a decline of 60%. Is there more downside to come or is the worst over for Texas Tea?
Position: N/A
| In the coming months, no doubt, stories will emerge about traders who took short positions in oil around mid-year 2014 became multi-millionaires (if they weren't already). The rest of us can be forgiven for not joining the trade — it is rare indeed that a major commodity like oil gives up more than half its value in less than a year. |

|
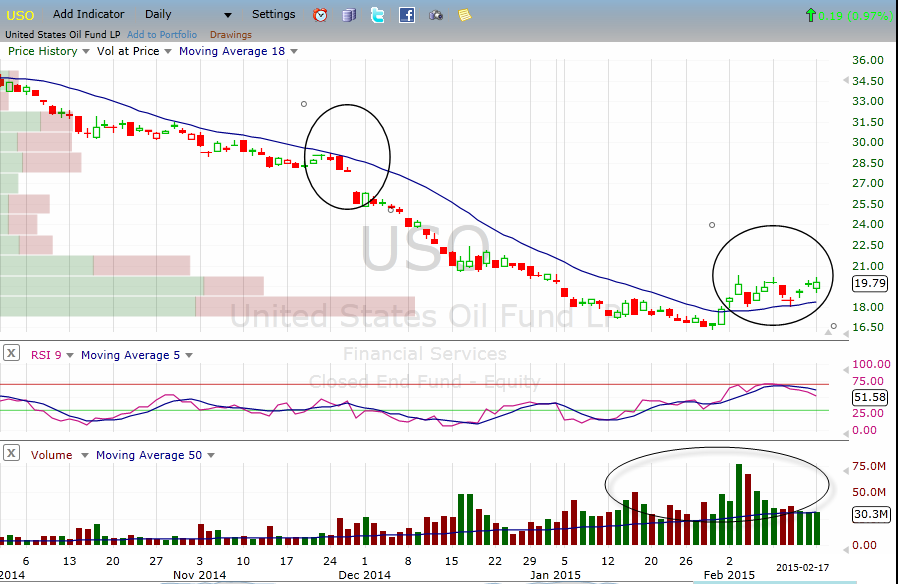
| Figure 1. Daily Chart Of US Oil Fund (USO). Here you see how the 18-day simple moving average acts as resistance during the latter part of 2014 and into 2015 before it was broken. It looks to now be forming a support level. |
| Graphic provided by: Freestockcharts.com. |
| |
| As far as commodities go however, what goes down must go back up at some point and many are wondering when that will occur in the oil market. However, there are a lot of moving parts to the oil game. First, OPEC (the Organization of Petroleum Exporting Countries) has kept the spigots open and increased supply which usually means lower prices. Demand, especially in developed nations like the US has continually dropped thanks to more fuel efficient vehicles, fewer miles being driven, increased use of transit by younger generations, and a trend away from oil fired electric generating stations. Compounding the oil price equation is the big increase in supplies from shale oil and gas domestically in the US and other nations around the globe. However, at $50 per barrel, many producers will find profits challenging and hundreds of rigs have already been shut down which will constrain supplies. |

|
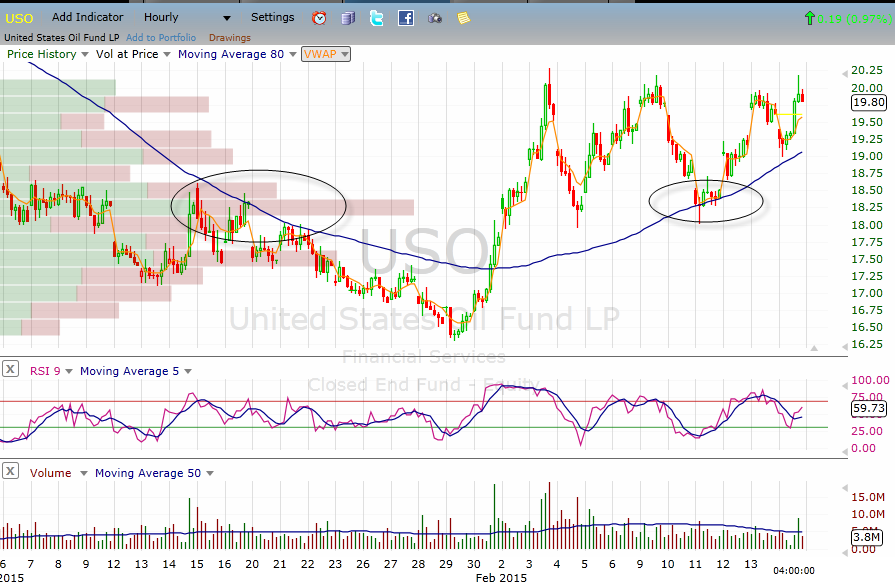
| Figure 2. Hourly Chart of USO. The 80-period simple moving average provided resistance and then support as the stock changed direction. |
| Graphic provided by: Freestockcharts.com. |
| |
| So how does one trade it? As you see in Figure 2 showing the hourly USO chart, the price is near an interim high around $19.80. On the hourly, the 80-period moving average (MA) has provided a reliable indicator — as resistance on the way down and then support as long as the stock rallies. I like to buy on weakness at support using either the 80 period MA on the hourly or 18-day MA on the daily chart as seen in Figure 1. |
| If either is broken, especially on above average volume, all bullish bets are off which could spell the beginning of another down leg in oil. |
Matt Blackman is a full-time technical and financial writer and trader. He produces corporate and financial newsletters, and assists clients in getting published in the mainstream media. He is the host of TradeSystemGuru.com. Matt has earned the Chartered Market Technician (CMT) designation. Find out what stocks and futures Matt is watching on Twitter at www.twitter.com/RatioTrade
| Company: | TradeSystemGuru.com |
| Address: | Box 2589 |
| Garibaldi Highlands, BC Canada | |
| Phone # for sales: | 604-898-9069 |
| Fax: | 604-898-9069 |
| Website: | www.tradesystemguru.com |
| E-mail address: | indextradermb@gmail.com |
Traders' Resource Links | |
| TradeSystemGuru.com has not added any product or service information to TRADERS' RESOURCE. | |
Click here for more information about our publications!
Comments

Request Information From Our Sponsors
- VectorVest, Inc.
- Executive Premier Workshop
- One-Day Options Course
- OptionsPro
- Retirement Income Workshop
- Sure-Fire Trading Systems (VectorVest, Inc.)
- Trading as a Business Workshop
- VectorVest 7 EOD
- VectorVest 7 RealTime/IntraDay
- VectorVest AutoTester
- VectorVest Educational Services
- VectorVest OnLine
- VectorVest Options Analyzer
- VectorVest ProGraphics v6.0
- VectorVest ProTrader 7
- VectorVest RealTime Derby Tool
- VectorVest Simulator
- VectorVest Variator
- VectorVest Watchdog
- StockCharts.com, Inc.
- Candle Patterns
- Candlestick Charting Explained
- Intermarket Technical Analysis
- John Murphy on Chart Analysis
- John Murphy's Chart Pattern Recognition
- John Murphy's Market Message
- MurphyExplainsMarketAnalysis-Intermarket Analysis
- MurphyExplainsMarketAnalysis-Visual Analysis
- StockCharts.com
- Technical Analysis of the Financial Markets
- The Visual Investor
