HOT TOPICS LIST
- MACD
- Fibonacci
- RSI
- Gann
- ADXR
- Stochastics
- Volume
- Triangles
- Futures
- Cycles
- Volatility
- ZIGZAG
- MESA
- Retracement
- Aroon
INDICATORS LIST
LIST OF TOPICS
PRINT THIS ARTICLE
by Donald W. Pendergast, Jr.
The widely followed S&P 500 index may soon challenge or even exceed its December 2014 all-time high.
Position: N/A
Donald W. Pendergast, Jr.
Freelance financial markets writer and online publisher of the Trendzetterz.com S&P 500 Weekly Forecast service.
PRINT THIS ARTICLE
CYCLES
SPY: Fresh Weekly Cycle Low, More Gains Likely
02/18/15 01:08:28 PMby Donald W. Pendergast, Jr.
The widely followed S&P 500 index may soon challenge or even exceed its December 2014 all-time high.
Position: N/A
| The incredible, nearly six-year old rally in the US stock market continues to amaze retail and professional traders alike; this is certainly the strongest consistent monthly uptrend in the S&P 500 index (.SPX) ever recorded and with the weekly and monthly cycles now in bullish agreement again, it does appear that yet another strong surge in large cap stock prices is a high probability event waiting to happen — and in fact, it's already underway. Here's a closer look now. |

|
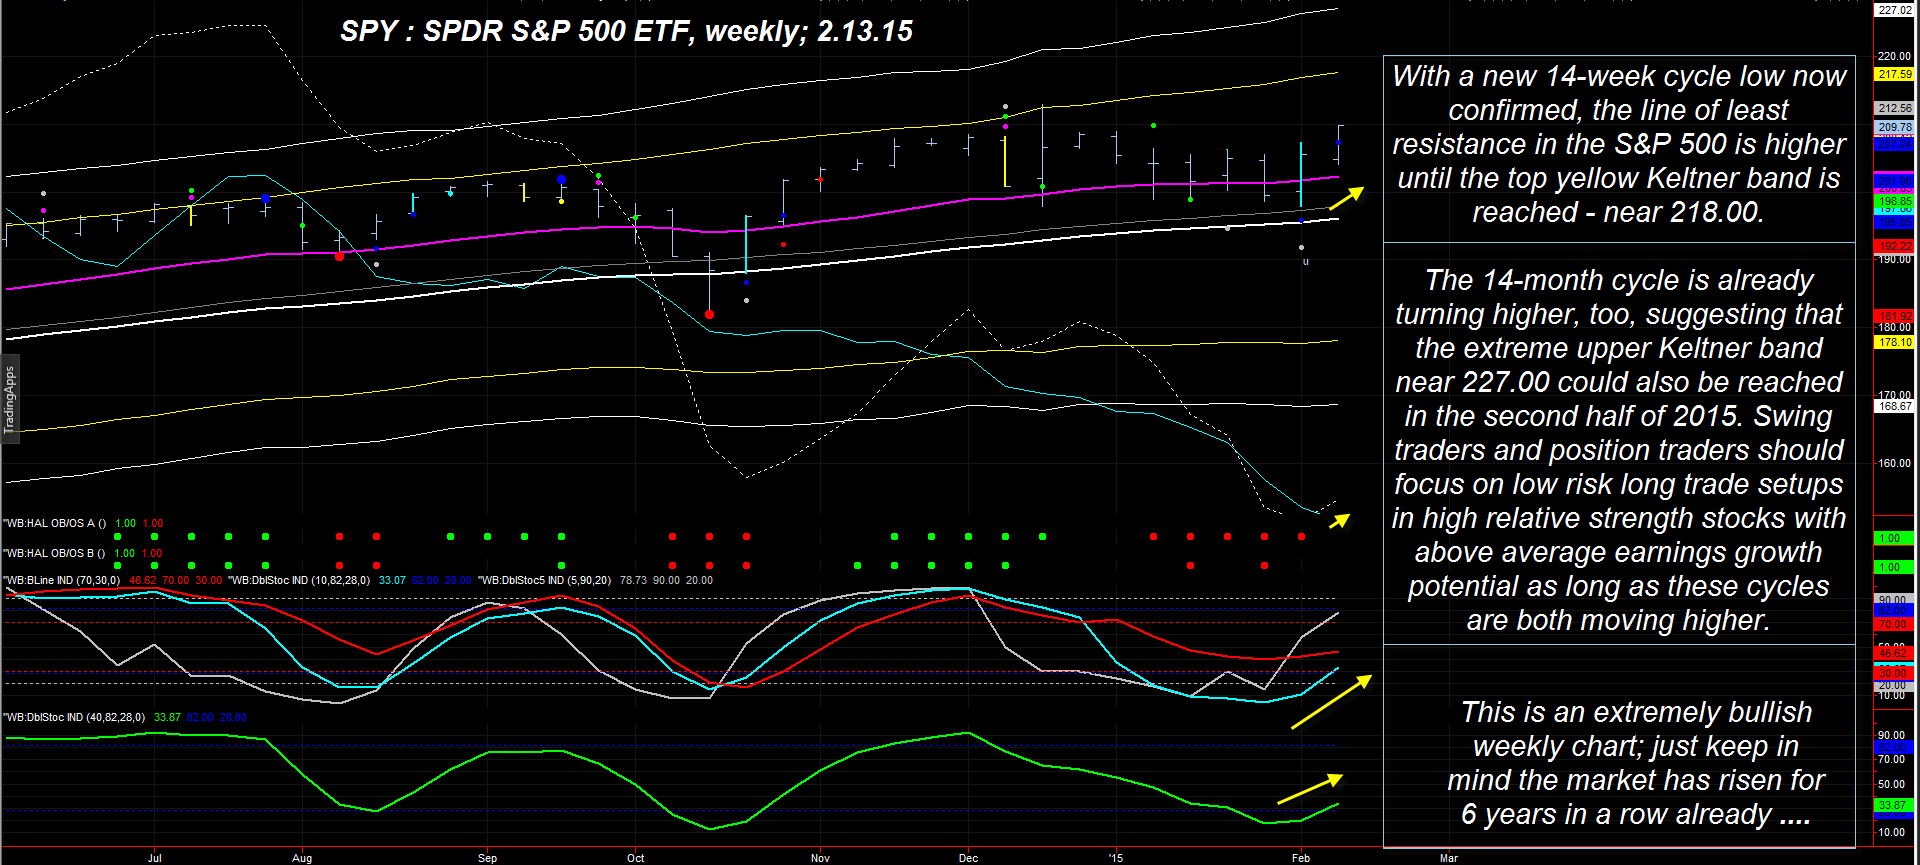
| Figure 1. SPDR S&P 500 ETF (SPY): With a fresh 14-week cycle low now in place for the S&P 500 index, the line of least resistance is once again toward higher prices. |
| Graphic provided by: TradeStation. |
| Graphic provided by: ProfitTrader7 from www.walterbressert.com. |
| |
| The chart in Figure 1 is a weekly of SPY; it's so blatantly bullish (to a skilled cycles technician) that it almost needs no explanation; however, you need to understand the 'big picture' and thus I offer this brief synopsis: 1. The dominant weekly price cycle in .SPX and SPY is 14-weeks, trough to trough; staying on the 'right' side of this cycle is absolutely critical if you want to make money. This cycle bottomed this past week and is now expected to rally until mid-to-late March 2015 at the earliest and until mid-April to-early May 2015 until the latest. 2. The minimum price target projection is near the top yellow Keltner band — near 215.00-217.00. 3. The 14-month cycle is also in rising mode, having bottomed in October 2014, and if this cycle keeps exerting influence, then the upper Keltner band may also be reached several months hence (currently near 227.00). 4. Three of the four key moving averages used to calculate momentum are confirming strong upward momentum. 5. The 89-week Chaikin money flow histogram (not shown) is still bullish, although not quite as bullish as it was at the September 2014 highs achieved by SPY. Taken together as a whole, the weekly/monthly cyclical, momentum, trend, and money flow dynamics for SPY are about as bullish as they can be for an extremely mature multiyear trend. Those with a 'perma-bear' market bias may find this difficult to accept, since they've been inculcated with the same old 'doom & gloom market crash' mentality that has been so prevalent for the past 15 years now. A wise technician will simply trust the probabilities depicted by such bullish chart dynamics and then allocate his (or his client's) trading and investment capital accordingly. |

|
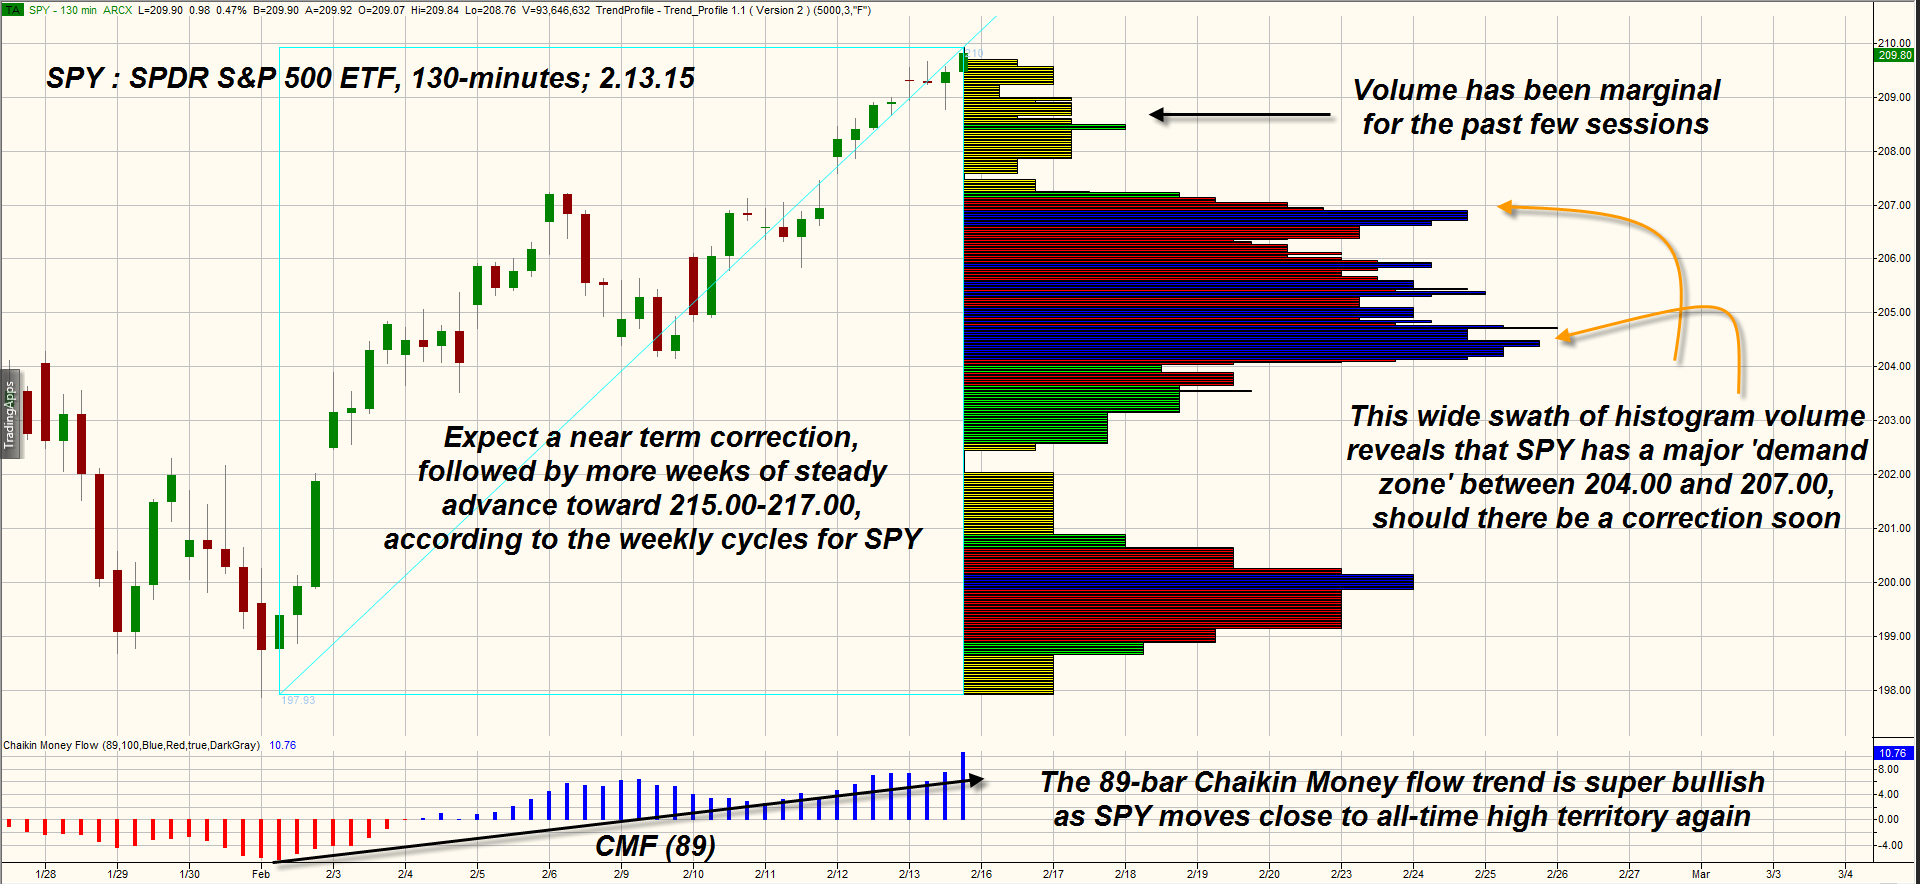
| Figure 2. 130-MINUTE TREND PROFILE CHART. The Trend Profile volume chart reveals a heavy demand area in SPY between the 204.00 to 207.00 area. |
| Graphic provided by: TradeStation. |
| Graphic provided by: Trend Profile from www.trading-algo.com. |
| |
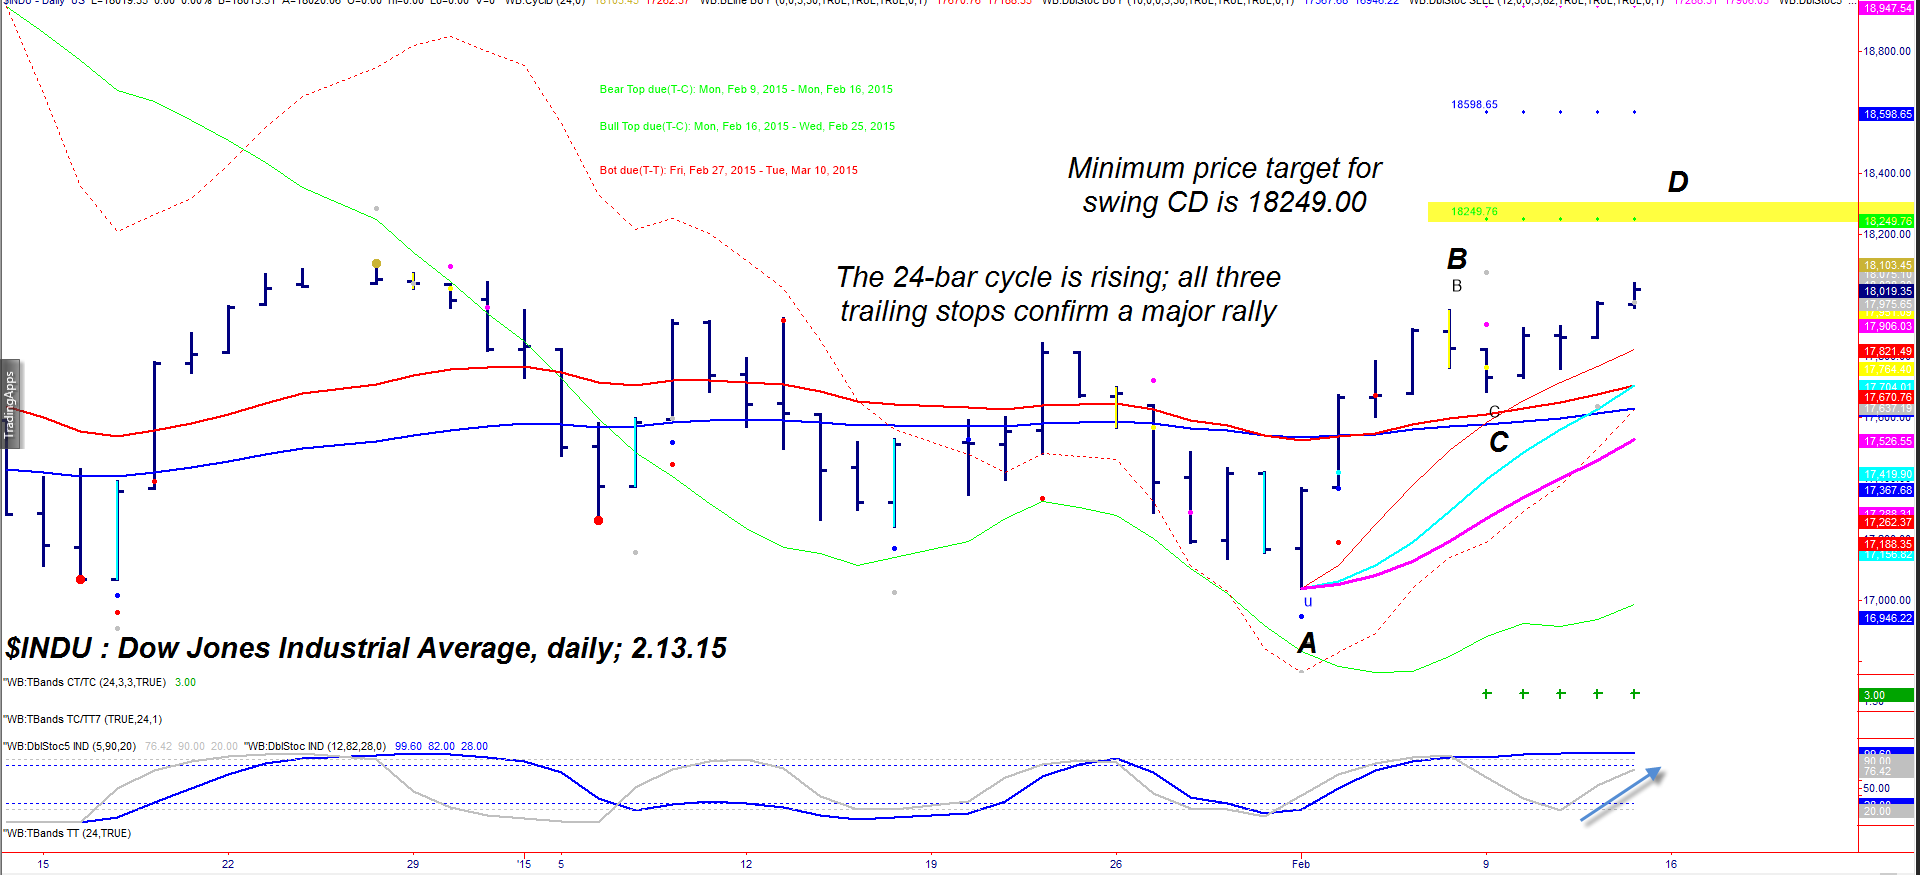
| This 130-minute Trend Profile chart for SPY in Figure 2 should also be of great interest to swing traders; price cycles and volume analysis make a potent analysis team, and this volume-derived chart also gives us some hints about SPY's near term and longer term direction: 1. Even on this shorter time frame chart, the money flow histogram is astoundingly bullish (CMF)(89). 2. The volume histogram on the chart (Trend Profile) reveals that the past few trading sessions had very light volume (a warning of a cycle high approaching, usually), and this could mean a few days of consolidation or even a mild pullback ahead. 3. However, look at the huge volume histogram that spans all the way from 204.00 to 207.00; this is a major area of potential support (a demand zone) for any upcoming pullback and with the bullish weekly and monthly cycles driving higher, this would be a no-brainer place to enter new swing trades during the second half of February 2015. Traders who agree with this cyclical, momentum and money flow analysis would do well to buy only high quality, high relative strength large cap stocks with above average earnings growth potential (such as those recommended to my S&P 500 weekly cycles forecast subscribers) and to deploy only conservative allocations of cash into stocks, given the multiyear nature of this epic rally in the US stock market. Just for fun, I have also included a daily chart for the Dow 30 Industrials ($INDU, @YM, DIA) in Figure 3, one that also shows a powerful 24-day bullish cycle hard at work; this cycle is not expected to top until February 25, 2015 and the next price target is 18,249.00 — believe it or not. Good trading to you and thanks for reading. |

|
| Figure 3. DAILY CHART OF DOW JONES INDUSTRIAL AVERAGE. The next Fibonacci swing price target for $INDU is 18249.00 and may be reached by late February 2015. |
| Graphic provided by: TradeStation. |
| Graphic provided by: ProfitTrader 7 by www.walterbressert.com. |
| |
Freelance financial markets writer and online publisher of the Trendzetterz.com S&P 500 Weekly Forecast service.
| Title: | Market consultant and writer |
| Company: | Trendzetterz |
| Address: | 81 Hickory Hollow Drive |
| Crossville, TN 38555 | |
| Phone # for sales: | 904-303-4814 |
| Website: | trendzetterz.com |
| E-mail address: | support@trendzetterz.com |
Traders' Resource Links | |
| Trendzetterz has not added any product or service information to TRADERS' RESOURCE. | |
Click here for more information about our publications!
Comments
Date: 02/18/15Rank: 5Comment:

Request Information From Our Sponsors
- VectorVest, Inc.
- Executive Premier Workshop
- One-Day Options Course
- OptionsPro
- Retirement Income Workshop
- Sure-Fire Trading Systems (VectorVest, Inc.)
- Trading as a Business Workshop
- VectorVest 7 EOD
- VectorVest 7 RealTime/IntraDay
- VectorVest AutoTester
- VectorVest Educational Services
- VectorVest OnLine
- VectorVest Options Analyzer
- VectorVest ProGraphics v6.0
- VectorVest ProTrader 7
- VectorVest RealTime Derby Tool
- VectorVest Simulator
- VectorVest Variator
- VectorVest Watchdog
- StockCharts.com, Inc.
- Candle Patterns
- Candlestick Charting Explained
- Intermarket Technical Analysis
- John Murphy on Chart Analysis
- John Murphy's Chart Pattern Recognition
- John Murphy's Market Message
- MurphyExplainsMarketAnalysis-Intermarket Analysis
- MurphyExplainsMarketAnalysis-Visual Analysis
- StockCharts.com
- Technical Analysis of the Financial Markets
- The Visual Investor
