HOT TOPICS LIST
- MACD
- Fibonacci
- RSI
- Gann
- ADXR
- Stochastics
- Volume
- Triangles
- Futures
- Cycles
- Volatility
- ZIGZAG
- MESA
- Retracement
- Aroon
INDICATORS LIST
LIST OF TOPICS
PRINT THIS ARTICLE
by Gary Grosschadl
The airline giant has made a bold move off a probable double bottom. Does it have enough lift to continue?
Position: Buy
Gary Grosschadl
Independent Canadian equities trader and technical analyst based in Peterborough
Ontario, Canada.
PRINT THIS ARTICLE
REVERSAL
Boeing Thrusts Upwards
11/08/02 11:44:44 AMby Gary Grosschadl
The airline giant has made a bold move off a probable double bottom. Does it have enough lift to continue?
Position: Buy
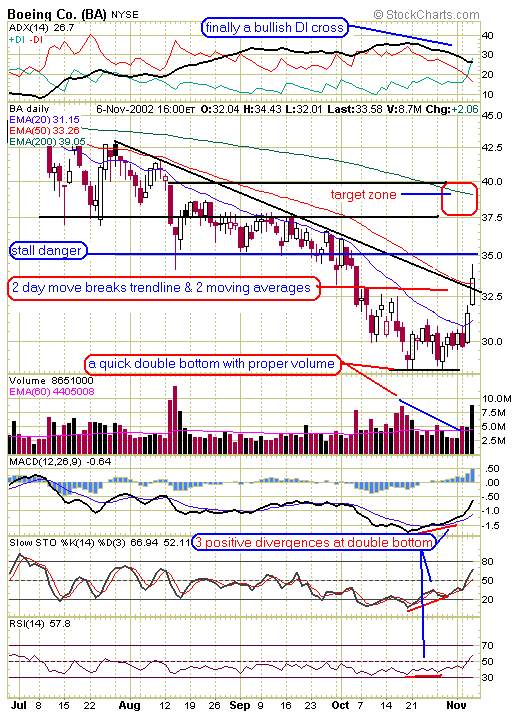
| Ideally a double bottom formation has a longer time interval between bottoms than those shown on Boeing, but this sudden move draws attention. The volume signature is correct as there is less volume on the second bottom suggesting a drying up of bearish selling power. |
| The first large bullish candle broke through the 20-day EMA line with conviction followed by an even bigger move the next day. The gap up propelled BA through the 50-day EMA line as well as a short-term trendline on excellent volume. There was some advance clue that a move was coming by virtue of the positive divergences shown on the displayed indicators. Also note this is the first time in a long time that the directional movement indicator has registered a bullish crossover of the DIs (top of chart). |

|
| Graphic provided by: StockCharts.com. |
| |
| The obvious question is - has the stock moved too far too fast? There is a stall danger possible around $35. This was the previous support line and could act as future resistance. It is likely that a breather is in order soon and it is much safer to pursue this stock during the next retracement/breather. There is a possibility that the stock can keep running but only on exceptional volume. Aggressive traders will likely buy on this possibility with a tight stop-loss. Either way a prudent target going forward, should the stock make it past the initial stall zone, is likely at $37.50 - 40 based on a previous congestion/resistance zone of $37.50 and overhead 200-day EMA resistance at around $39. |
| Chasing a 10 percent move in two days is not for the faint of heart. It is safer to wait and see how this stock acts at the next retracement, possibly a very brief one with this kind of momentum. |
Independent Canadian equities trader and technical analyst based in Peterborough
Ontario, Canada.
| Website: | www.whatsonsale.ca/financial.html |
| E-mail address: | gwg7@sympatico.ca |
Click here for more information about our publications!
Comments
Date: 11/12/02Rank: 4Comment:
Date: 11/14/02Rank: 5Comment:
Date: 11/17/02Rank: 4Comment:

Request Information From Our Sponsors
- VectorVest, Inc.
- Executive Premier Workshop
- One-Day Options Course
- OptionsPro
- Retirement Income Workshop
- Sure-Fire Trading Systems (VectorVest, Inc.)
- Trading as a Business Workshop
- VectorVest 7 EOD
- VectorVest 7 RealTime/IntraDay
- VectorVest AutoTester
- VectorVest Educational Services
- VectorVest OnLine
- VectorVest Options Analyzer
- VectorVest ProGraphics v6.0
- VectorVest ProTrader 7
- VectorVest RealTime Derby Tool
- VectorVest Simulator
- VectorVest Variator
- VectorVest Watchdog
- StockCharts.com, Inc.
- Candle Patterns
- Candlestick Charting Explained
- Intermarket Technical Analysis
- John Murphy on Chart Analysis
- John Murphy's Chart Pattern Recognition
- John Murphy's Market Message
- MurphyExplainsMarketAnalysis-Intermarket Analysis
- MurphyExplainsMarketAnalysis-Visual Analysis
- StockCharts.com
- Technical Analysis of the Financial Markets
- The Visual Investor
