HOT TOPICS LIST
- MACD
- Fibonacci
- RSI
- Gann
- ADXR
- Stochastics
- Volume
- Triangles
- Futures
- Cycles
- Volatility
- ZIGZAG
- MESA
- Retracement
- Aroon
INDICATORS LIST
LIST OF TOPICS
PRINT THIS ARTICLE
by Koos van der Merwe
When an obvious head & shoulders pattern has bottomed, does it mean it's time to buy for a long-term hold?
Position: Accumulate
Koos van der Merwe
Has been a technical analyst since 1969, and has worked as a futures and options trader with First Financial Futures in Johannesburg, South Africa.
PRINT THIS ARTICLE
TECHNICAL ANALYSIS
Tesla Motors, Is It Time To Buy?
02/18/15 05:20:06 PMby Koos van der Merwe
When an obvious head & shoulders pattern has bottomed, does it mean it's time to buy for a long-term hold?
Position: Accumulate
| The head & shoulders (H&S) pattern is one of the most common and also one of the most reliable of all the major reversal patterns. It consists of a left shoulder, a head and a right shoulder. The left shoulder is formed usually at the end of an extensive advance during which volume is quite heavy. At the end of the left shoulder, there is usually a small dip or recession which typically occurs on low volume. The head then forms with heavy volume on the upside with lesser volume accompanying the subsequent reaction. At this point, prices would come down to somewhere near the low of the left shoulder — sometimes lower or sometimes higher, but in any case below that of the top of the left shoulder. The right shoulder is then formed by a rally on usually less volume than previous rallies in this formation. A neckline is then drawn across the bottoms of the left shoulder, the head, and the right shoulder. A break of this neckline from the right shoulder is the final confirmation and completes the H&S top formation. This is the signal to sell short. To determine how far a price is likely to fall, measure the distance vertically from the top of the head to the neckline, then subtract that distance from the neckline. This will suggest a possible minimum target. |

|
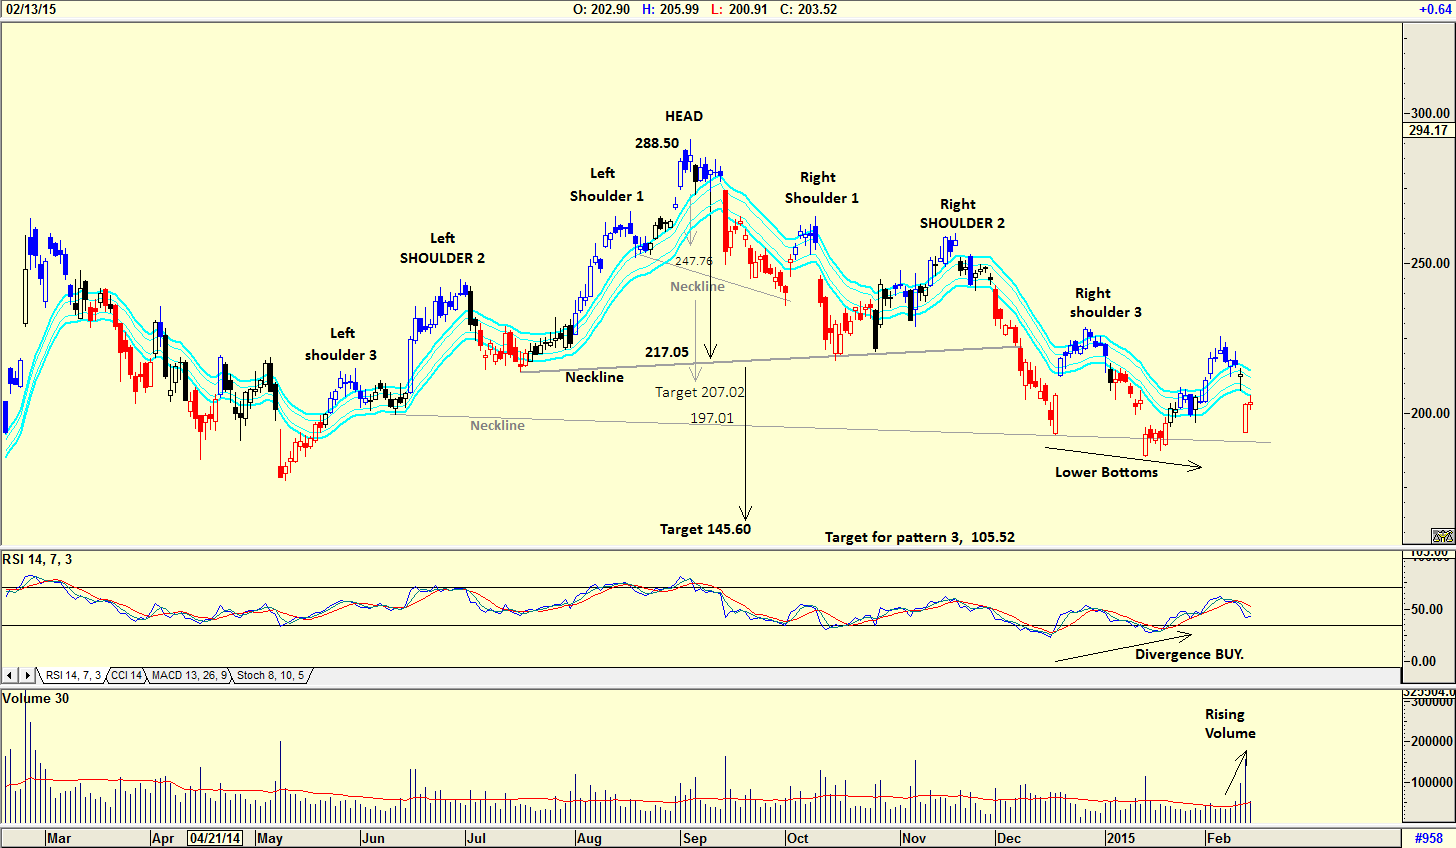
| Figure 1. Daily Chart Of Tesla Motors. Here you see a head & shoulders reversal formation occurring on the price chart. |
| Graphic provided by: AdvancedGET. |
| |
| Looking at the chart of Tesla Motors Inc. (TSLA) in Figure 1, you can see that a number of H&S formations developed. The H&S pattern 1 suggests a target of $207.02 (288.50-247.76 =40.74; 247.76-40.74=207.02). The target for pattern 2 is $145.60 (288.50-217.05=71.45; 217.05-71.45=145.60). The target for pattern 3 is $105.52 (288.50-197.01=91.49; 197.01-91.49=105.52). I have not shown this target on the chart. So, which target do you accept if you had shorted the stock as the H&S pattern suggested? Looking at the relative strength index (RSI) one can see that a divergence buy has been given. A divergence buy is when the RSI has rising bottoms with the share price forming lower bottoms. This is usually a strong signal. Do note also that volume strengthened as the share price fell, and that when the share price rose on February 13, volume fell. This is a sign of more weakness to come. |

|
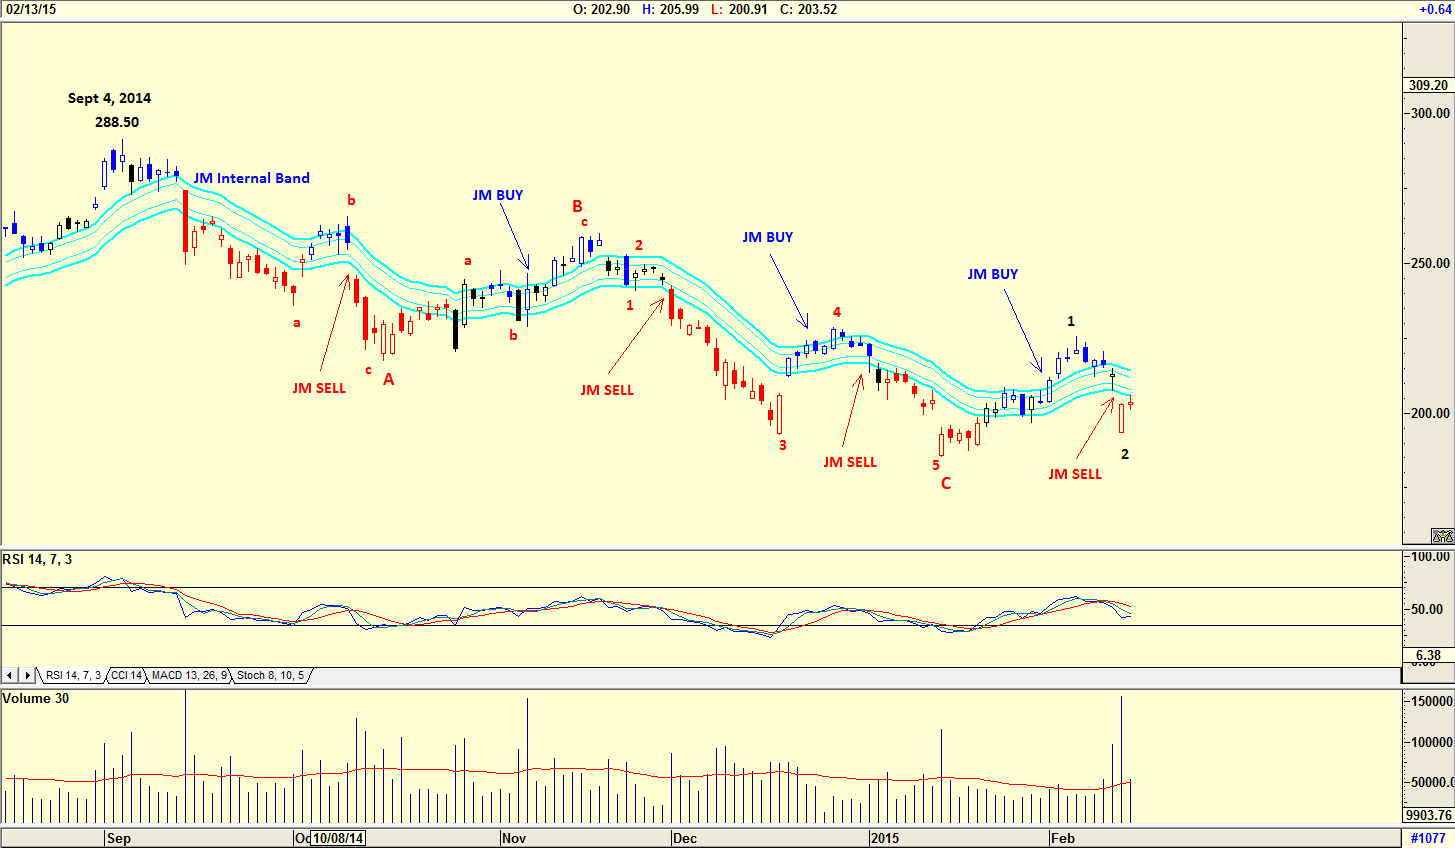
| Figure 2. Daily Chart Of Tesla Motors With Elliott Waves. Here you see that the share price is now rising in a wave 3 of a WAVE I in a new bull trend. |
| Graphic provided by: AdvancedGET. |
| |
| The chart in Figure 2 is also a daily chart of TSLA, with an Elliott wave count suggesting that an ABC trend is complete and that the share price is now rising in a wave 3 of a WAVE I in a new bull trend. The chart also shows a JM internal band. The JM internal band is a 15-period simple moving average offset by 2% positive and 2% negative. A move above the upper band suggests a buy and a move below the lower band, a sell. At the moment the share price is still a sell. A JM buy signal has not been given. Finally note the color of the various candlesticks. The color is decided by the XTL Parameter offered by the Advanced GET program. The XTL (eXpert Trend Locator) uses a statistical evaluation of the market that can tell the difference between random market swings (noise) and directed market swings (trends). An up trend is identified by blue bars, a downtrend by red bars, and neutral by a black bar. At present the bars are red suggesting weakness. As a trader, I would possibly be a buyer of TSLA shares, based on the Elliott wave analysis, expecting a rise into Wave 3, and that the H&S pattern is suggesting a possible bottom. As an investor, I would wait for a JM internal band buy signal to be triggered. |
Has been a technical analyst since 1969, and has worked as a futures and options trader with First Financial Futures in Johannesburg, South Africa.
| Address: | 3256 West 24th Ave |
| Vancouver, BC | |
| Phone # for sales: | 6042634214 |
| E-mail address: | petroosp@gmail.com |
Click here for more information about our publications!
PRINT THIS ARTICLE

|

Request Information From Our Sponsors
- StockCharts.com, Inc.
- Candle Patterns
- Candlestick Charting Explained
- Intermarket Technical Analysis
- John Murphy on Chart Analysis
- John Murphy's Chart Pattern Recognition
- John Murphy's Market Message
- MurphyExplainsMarketAnalysis-Intermarket Analysis
- MurphyExplainsMarketAnalysis-Visual Analysis
- StockCharts.com
- Technical Analysis of the Financial Markets
- The Visual Investor
- VectorVest, Inc.
- Executive Premier Workshop
- One-Day Options Course
- OptionsPro
- Retirement Income Workshop
- Sure-Fire Trading Systems (VectorVest, Inc.)
- Trading as a Business Workshop
- VectorVest 7 EOD
- VectorVest 7 RealTime/IntraDay
- VectorVest AutoTester
- VectorVest Educational Services
- VectorVest OnLine
- VectorVest Options Analyzer
- VectorVest ProGraphics v6.0
- VectorVest ProTrader 7
- VectorVest RealTime Derby Tool
- VectorVest Simulator
- VectorVest Variator
- VectorVest Watchdog
