HOT TOPICS LIST
- MACD
- Fibonacci
- RSI
- Gann
- ADXR
- Stochastics
- Volume
- Triangles
- Futures
- Cycles
- Volatility
- ZIGZAG
- MESA
- Retracement
- Aroon
INDICATORS LIST
LIST OF TOPICS
PRINT THIS ARTICLE
by Koos van der Merwe
Given that there are so many stocks, finding the best ones that make sound investments is not that easy.
Position: Buy
Koos van der Merwe
Has been a technical analyst since 1969, and has worked as a futures and options trader with First Financial Futures in Johannesburg, South Africa.
PRINT THIS ARTICLE
TECHNICAL ANALYSIS
Old Dominion Freight Line, A Share To Watch
02/10/15 05:10:30 PMby Koos van der Merwe
Given that there are so many stocks, finding the best ones that make sound investments is not that easy.
Position: Buy
| Old Dominion Freight Line, Inc. (ODFL) is a $2.13 billion, less-than-truckload, union-free motor carrier providing regional, inter-regional, and national LTL service and value-added logistics services. The company, founded in 1934 by Earl and Lillian Congdon is headquartered in Thomasville, North Carolina and employs more than 15,000 people globally. Old Dominion also offers household moving services, and trade show shipping as part of their expedited division to accommodate all logistical needs. The company operates more than 5,800 tractors and more than 22,500 trailers. |

|
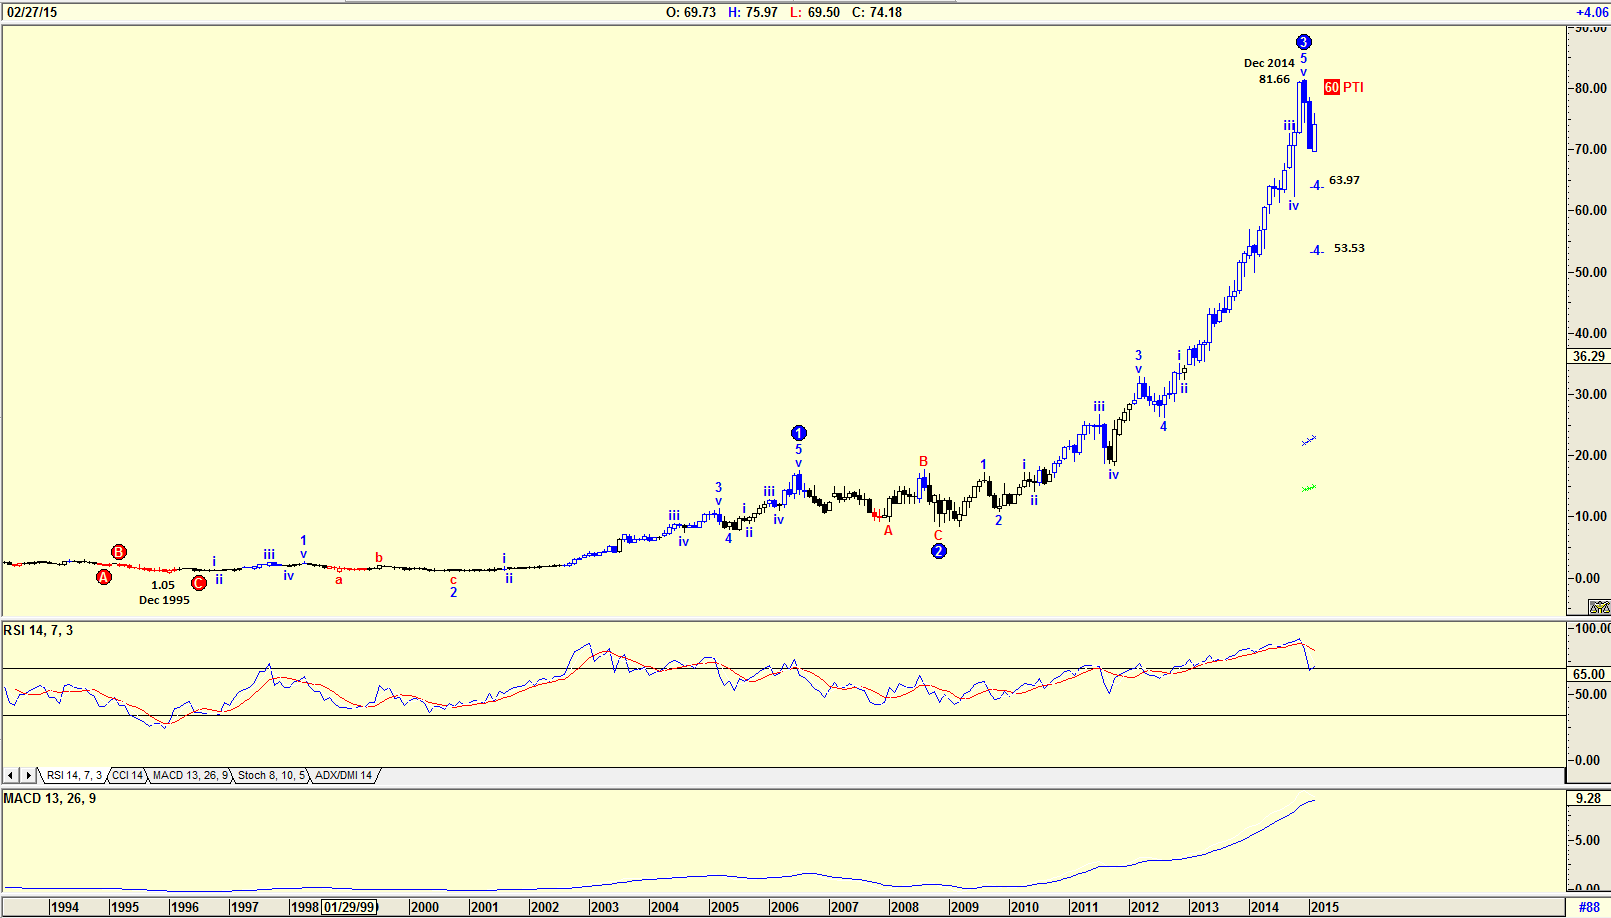
| Figure 1. Monthly Chart With Elliott Wave Count. The Elliott Wave count suggests that price has completed a major Wave 3. It is now in a Wave 4 that could take it to $63.97 or $53.53. |
| Graphic provided by: AdvancedGET. |
| |
| The chart in Figure 1 is a monthly chart showing how the share has climbed from a low of $1.04 in December 1995 to a high of $81.66 by December 2014. The Elliott wave count suggests that the share price completed a major WAVE 3 by December 2014, and that the share price is now in a WAVE 4 to either $63.97 or $53.53 as shown on the chart. The PTI (probability index) of 60 suggests that this drop is possible. The relative strength index (RSI) which is at overbought levels and the moving average convergence/divergence (MACD) are suggesting a sell signal. |

|
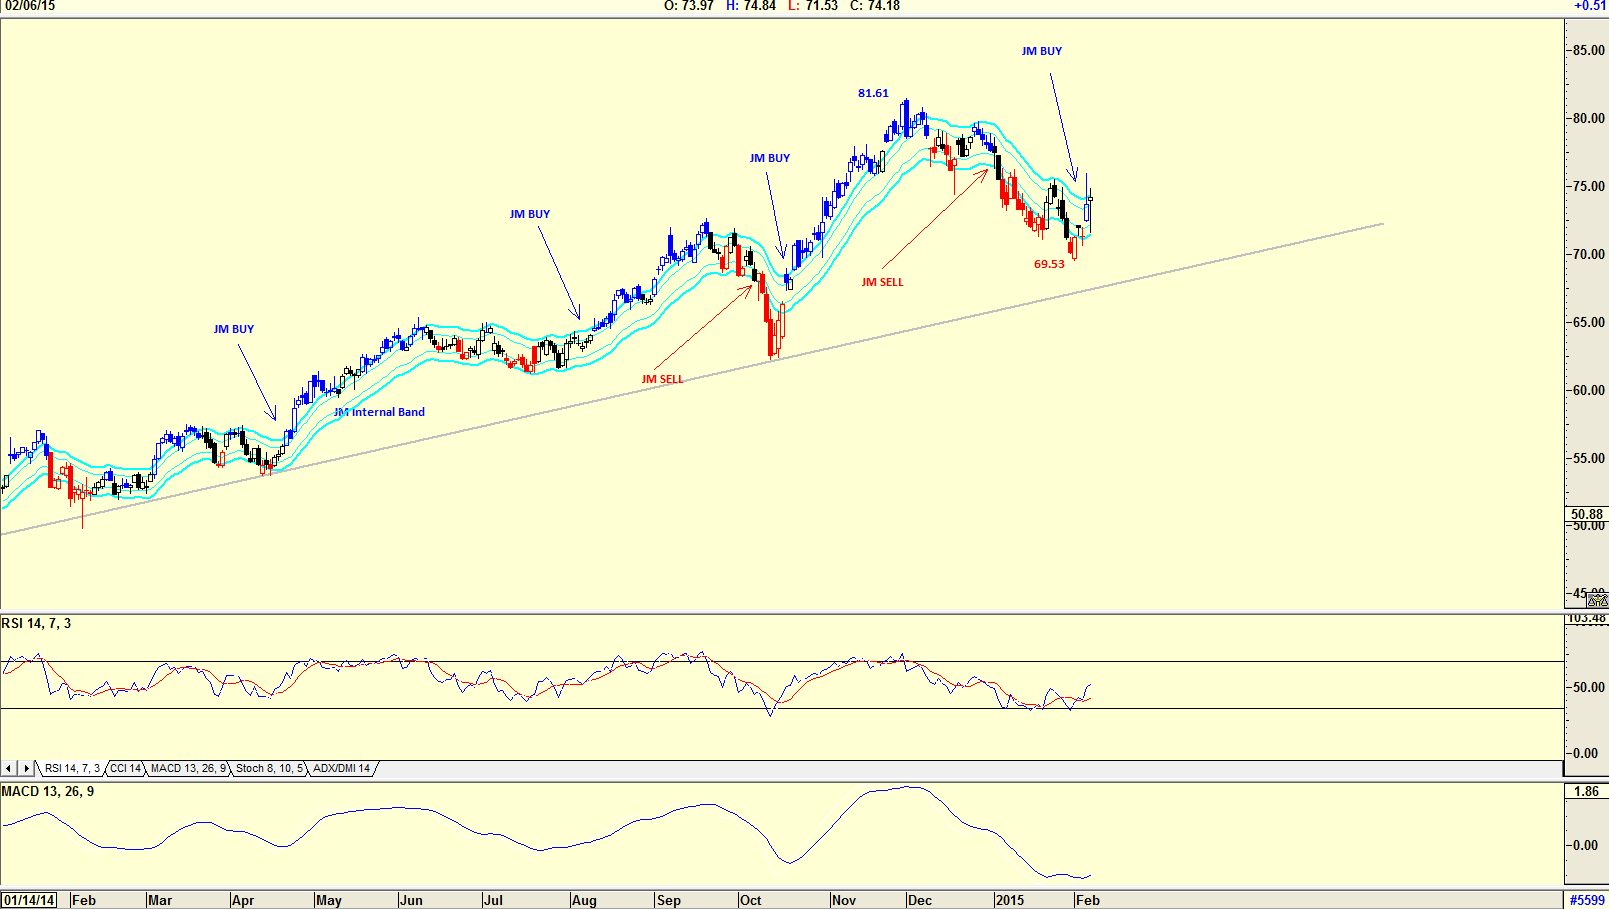
| Figure 2. Daily Chart With JM Internal Band. A move above the upper band suggests a buy signal and a move below the lower band a sell signal. |
| Graphic provided by: AdvancedGET. |
| |
| The chart in Figure 2 is a daily chart with a JM Internal Band indicator as well as an RSI and MACD indicator. The JM Internal Band indicator is a 15 period simple moving average offset by 2% positive and 2% negative. A move above the upper band suggests a buy signal, and a move below the lower band a sell signal. The RSI and MACD have suggested a buy as has the JM internal band indicator. |

|
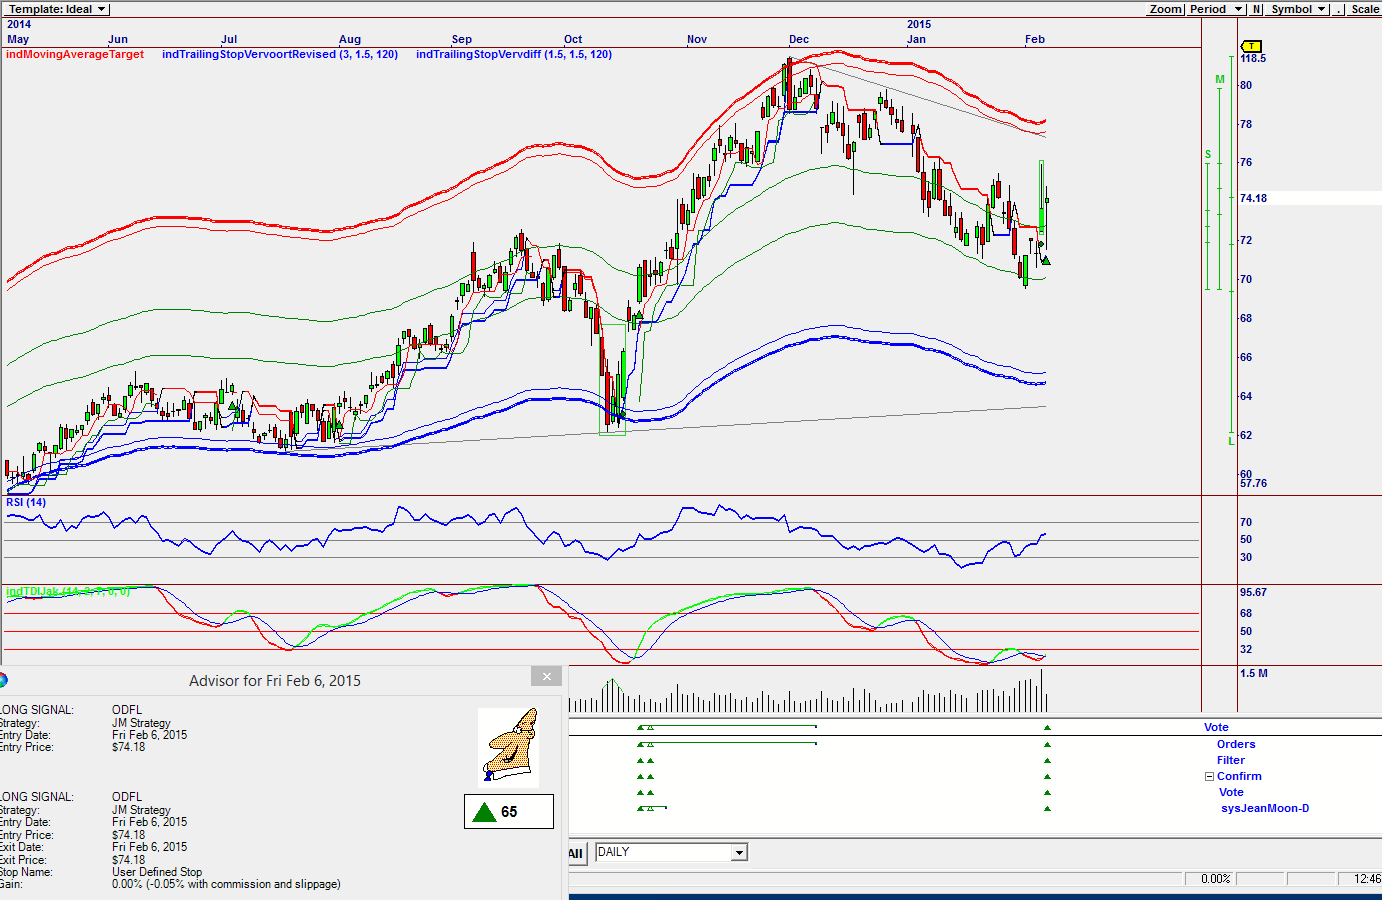
| Figure 3. Daily Omnitrader Chart. Here you see the buy signal on the Vote line adn an advisor rating of 60. |
| Graphic provided by: Omnitrader.. |
| |
| The chart in Figure 3 is an Omnitrader chart showing a Vote line buy signal based in the JM Strategy. The Advisor Rating as shown on the chart is 65, which is acceptable as a buy signal. Note that the RSI and the indTDIJak indicator have both given buy signals. On January 5, 2015 ODFL announced financial results for the three and 12 month periods that ended December 31, 2014. Fourth quarter revenue increased 21.7% from the same quarter in 2013. Net income rose 48.2% and earnings per share increased 29.7%. "By staying focused on delivering a superior service value to our customers, while also making the necessary investments in our capacity and our people, we believe we can continue to gain market share and produce further profitable growth." I feel this is a share worth adding to your portfolio. |
Has been a technical analyst since 1969, and has worked as a futures and options trader with First Financial Futures in Johannesburg, South Africa.
| Address: | 3256 West 24th Ave |
| Vancouver, BC | |
| Phone # for sales: | 6042634214 |
| E-mail address: | petroosp@gmail.com |
Click here for more information about our publications!
PRINT THIS ARTICLE

Request Information From Our Sponsors
- StockCharts.com, Inc.
- Candle Patterns
- Candlestick Charting Explained
- Intermarket Technical Analysis
- John Murphy on Chart Analysis
- John Murphy's Chart Pattern Recognition
- John Murphy's Market Message
- MurphyExplainsMarketAnalysis-Intermarket Analysis
- MurphyExplainsMarketAnalysis-Visual Analysis
- StockCharts.com
- Technical Analysis of the Financial Markets
- The Visual Investor
- VectorVest, Inc.
- Executive Premier Workshop
- One-Day Options Course
- OptionsPro
- Retirement Income Workshop
- Sure-Fire Trading Systems (VectorVest, Inc.)
- Trading as a Business Workshop
- VectorVest 7 EOD
- VectorVest 7 RealTime/IntraDay
- VectorVest AutoTester
- VectorVest Educational Services
- VectorVest OnLine
- VectorVest Options Analyzer
- VectorVest ProGraphics v6.0
- VectorVest ProTrader 7
- VectorVest RealTime Derby Tool
- VectorVest Simulator
- VectorVest Variator
- VectorVest Watchdog
