

HOT TOPICS LIST
- MACD
- Fibonacci
- RSI
- Gann
- ADXR
- Stochastics
- Volume
- Triangles
- Futures
- Cycles
- Volatility
- ZIGZAG
- MESA
- Retracement
- Aroon
INDICATORS LIST
LIST OF TOPICS
PRINT THIS ARTICLE
by Donald W. Pendergast, Jr.
Sina Corp. shares have begun the early stages of a rally and may eventually prove to be a major multiyear bullish trend reversal.
Position: N/A
Donald W. Pendergast, Jr.
Freelance financial markets writer and online publisher of the Trendzetterz.com S&P 500 Weekly Forecast service.
PRINT THIS ARTICLE
CHART ANALYSIS
SINA: Bullish Monthly Harmonic Pattern
02/09/15 05:06:32 PMby Donald W. Pendergast, Jr.
Sina Corp. shares have begun the early stages of a rally and may eventually prove to be a major multiyear bullish trend reversal.
Position: N/A
| Sina Corp. (SINA) is a large Chinese concern based in Shanghai; with more than 7,000 employees working its huge online media business. The stock enjoyed a massive rally from January 2009 to April 2011, gaining more than 650% in a 27 month period. A spectacular blow-off ensued afterward, which dropped SINA back into the mid-$50 range, and now the stock is trading even lower — near $37.00. However, there is bullish technical news for daily swing traders and longer term position traders and investors in this stock, and we'll examine two compelling charts now to make this bullish case plain. |
|
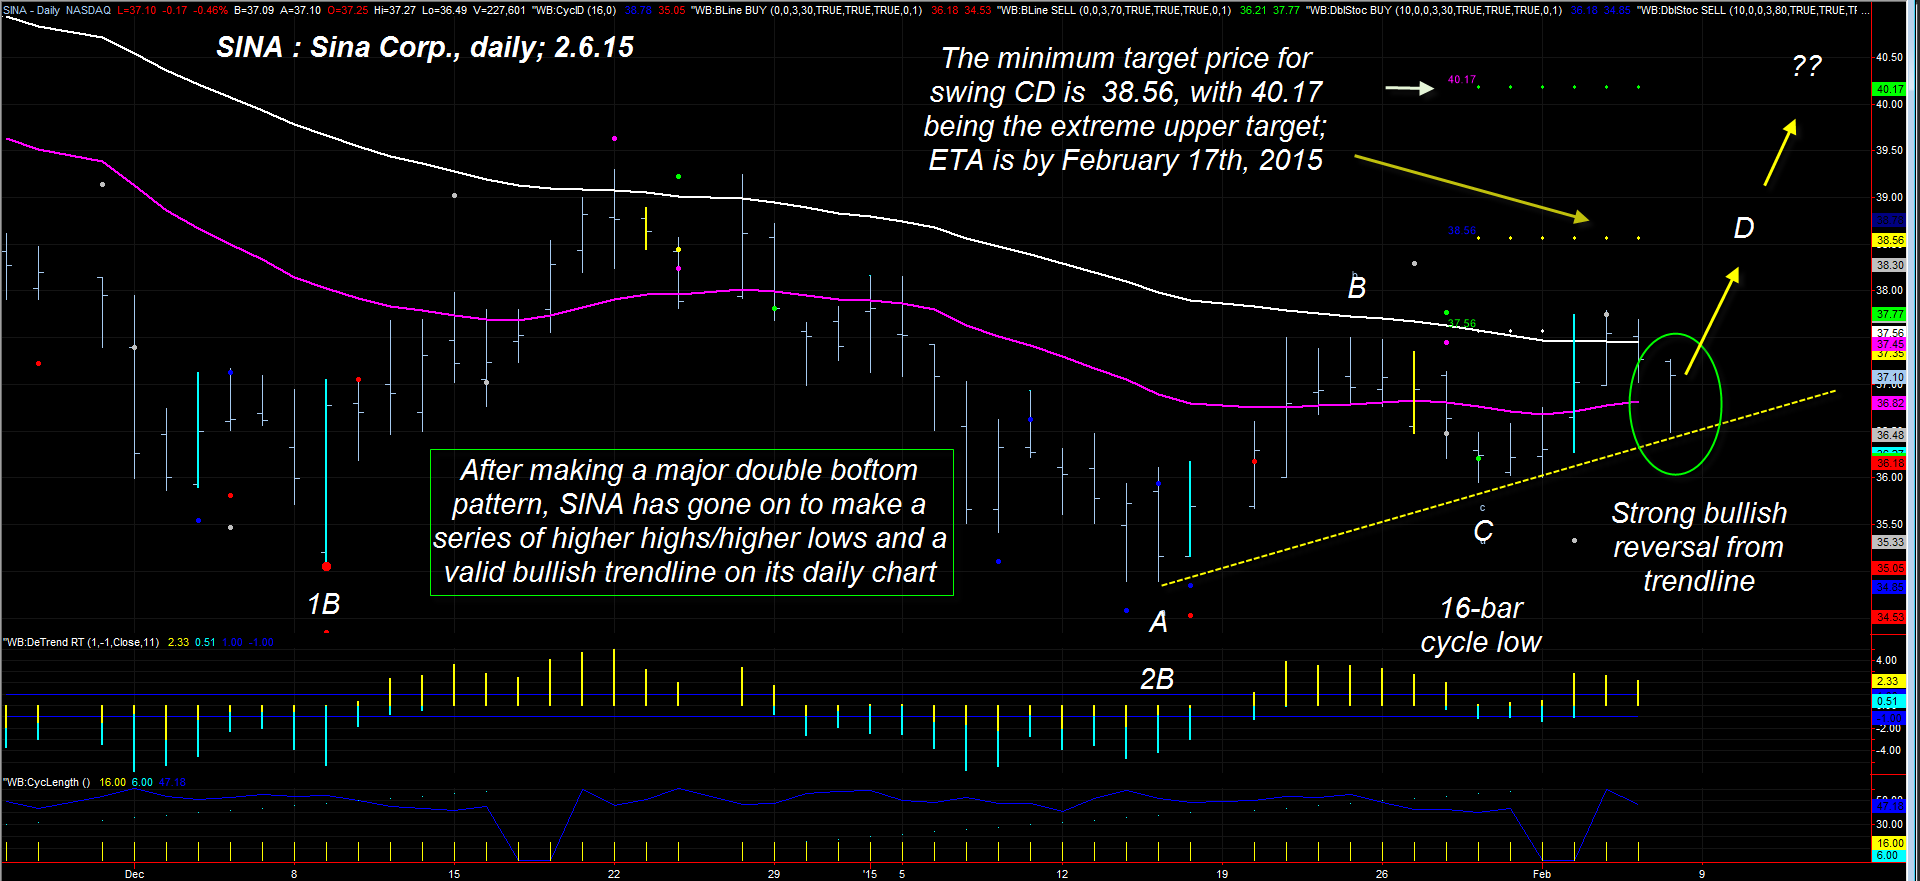
| Figure 1. Sina Corp. (SINA). A classic 'textbook' quality bullish reversal pattern continues to prove out on this large-cap Chinese stock's daily chart. |
| Graphic provided by: TradeStation. |
| Graphic provided by: ProfitTrader7 from www.walterbressert.com. |
| |
| Let's start with the daily chart of SINA (Figure 1), where price cycle, chart pattern and trend analysis reveals these bullish dynamics coming together in a powerful fashion: 1. A well-spaced double bottom pattern formed between December 2014 and January 2015 (1B and 2B). 2. The cycle finder algorithm, detrend oscillator, and plain old common sense confirm that the January 29, 2015 swing low is the valid 16-bar cycle low (dominant daily cycle in SINA). 3. A pattern of higher swing highs/higher swing lows has emerged in the wake of the double bottom pattern. 4. The spread between the two key cycle moving averages continues to narrow (bullish momentum). 5. The 16-bar cycle is now in a bullish phase and has a 70% chance of topping by February 17, 2015 and a 30% chance of topping at a later date. 6. The minimum Fibonacci swing price target for swing CD is 38.56; the extended bullish price target is 40.17. 7. Note the powerful bullish intraday reversal on the most recent bar (February 6, 2015) which helped validate the bullish uptrend line; this is a classic precursor to further gains. Altogether, these technicals are all working together to drive SINA higher for at least the next week to 10 days before any meaningful pause or profit taking ensues on the daily time frame. This is a good (no, an amazing!) setup for short-term put option sellers, by the way, as are all confirmed bullish trend reversal setups in highly liquid stocks. Now let's look at the 'big picture' for SINA, using its monthly chart. |
|
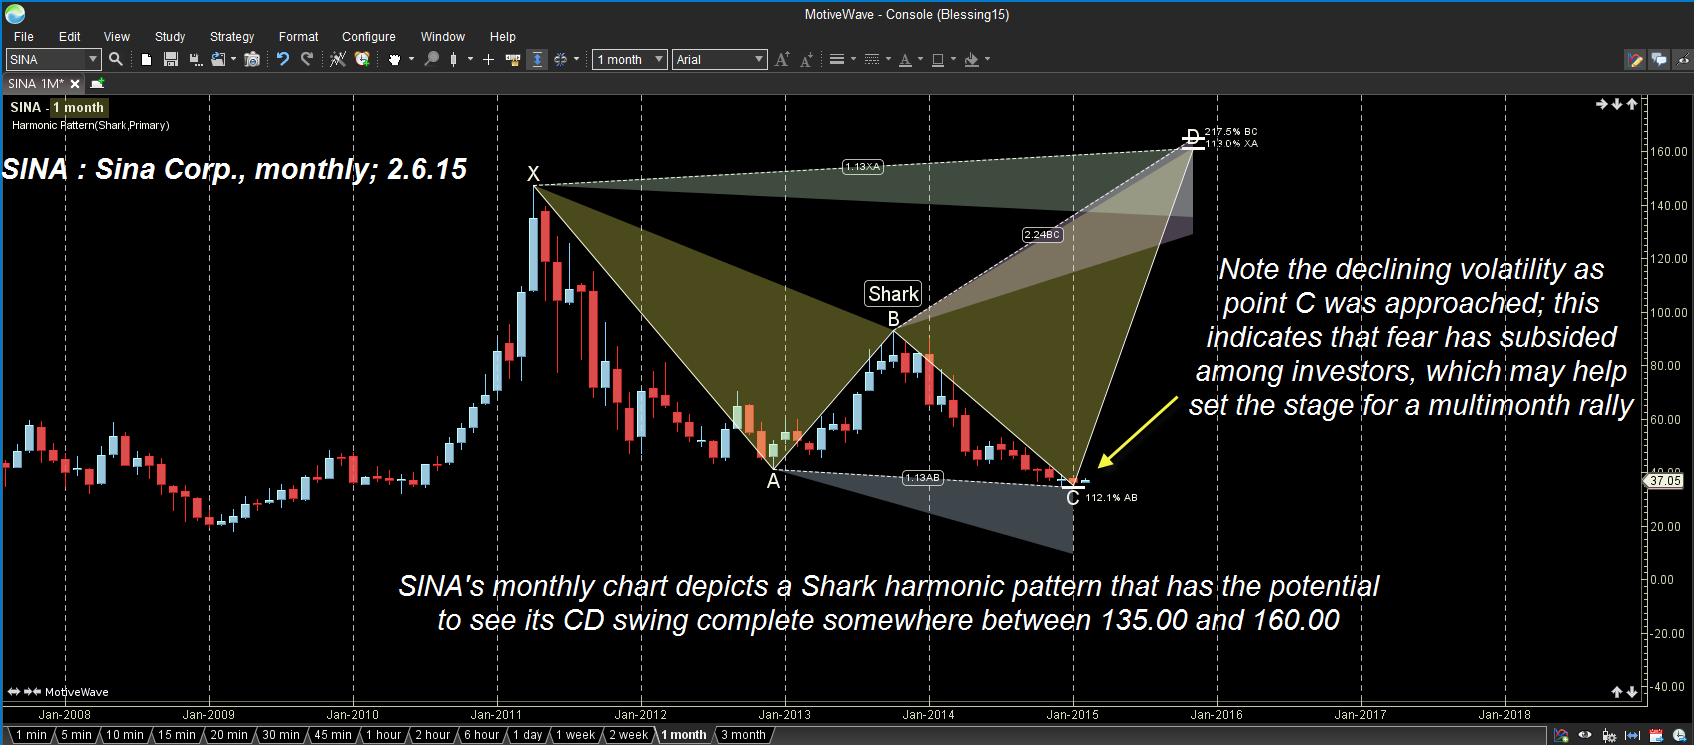
| Figure 2. Monthly Chart. SINA's monthly chart also paints a potentially bullish longer term scenario; this Shark harmonic pattern is especially well-formed. |
| Graphic provided by: MotiveWave Trading Software at www.motivewave.com. |
| |
| SINA's monthly chart in Figure 2 depicts a well-formed Shark harmonic pattern, one in which the XA, AB, and BC swings are complete; although it may seem impossible, note that swing CD has a projected pattern completion target price range of 135.00 to 160.00, which is a long way above the stock's current price of 37.10. Remember that although harmonic patterns can be good at providing advance notice of where key support/resistance levels are, they still need to be used within a broader, rational context of cycles, Elliott wave, money flow, volume and trend analysis. When you can put all of those dynamics to work in your charting regimen, you'll be far more able to put these potentially powerful patterns to work in your own day-to-day trading operation. Taken together as a whole, a compelling bullish scenario is taking form on SINA's charts and until these dynamics are disproved, trading this stock from the long side appears to be the most rational course of action for both swing traders and longer term trend followers. Trade wisely until we meet here again soon. |
Freelance financial markets writer and online publisher of the Trendzetterz.com S&P 500 Weekly Forecast service.
| Title: | Market consultant and writer |
| Company: | Trendzetterz |
| Address: | 81 Hickory Hollow Drive |
| Crossville, TN 38555 | |
| Phone # for sales: | 904-303-4814 |
| Website: | trendzetterz.com |
| E-mail address: | support@trendzetterz.com |
Traders' Resource Links | |
| Trendzetterz has not added any product or service information to TRADERS' RESOURCE. | |
Click here for more information about our publications!
PRINT THIS ARTICLE

Request Information From Our Sponsors
- StockCharts.com, Inc.
- Candle Patterns
- Candlestick Charting Explained
- Intermarket Technical Analysis
- John Murphy on Chart Analysis
- John Murphy's Chart Pattern Recognition
- John Murphy's Market Message
- MurphyExplainsMarketAnalysis-Intermarket Analysis
- MurphyExplainsMarketAnalysis-Visual Analysis
- StockCharts.com
- Technical Analysis of the Financial Markets
- The Visual Investor
- VectorVest, Inc.
- Executive Premier Workshop
- One-Day Options Course
- OptionsPro
- Retirement Income Workshop
- Sure-Fire Trading Systems (VectorVest, Inc.)
- Trading as a Business Workshop
- VectorVest 7 EOD
- VectorVest 7 RealTime/IntraDay
- VectorVest AutoTester
- VectorVest Educational Services
- VectorVest OnLine
- VectorVest Options Analyzer
- VectorVest ProGraphics v6.0
- VectorVest ProTrader 7
- VectorVest RealTime Derby Tool
- VectorVest Simulator
- VectorVest Variator
- VectorVest Watchdog