HOT TOPICS LIST
- MACD
- Fibonacci
- RSI
- Gann
- ADXR
- Stochastics
- Volume
- Triangles
- Futures
- Cycles
- Volatility
- ZIGZAG
- MESA
- Retracement
- Aroon
INDICATORS LIST
LIST OF TOPICS
PRINT THIS ARTICLE
by Koos van der Merwe
The question on everyone's mind is, "Have oil prices bottomed?"
Position: Accumulate
Koos van der Merwe
Has been a technical analyst since 1969, and has worked as a futures and options trader with First Financial Futures in Johannesburg, South Africa.
PRINT THIS ARTICLE
TECHNICAL ANALYSIS
Is It Time To Buy Oil?
02/03/15 05:20:09 PMby Koos van der Merwe
The question on everyone's mind is, "Have oil prices bottomed?"
Position: Accumulate
| The price of oil has fallen dramatically, from a high of $125 in February 2011 to the present price of less than $50. The reason is not clear yet. Many argue that the world is awash with oil. In 2000, the price of oil was in the region of $20 per barrel, and then rose to a high of $140 per barrel by 2007 encouraging fracking, the start of oil sand mining. In 2007 the price dropped below $50 per barrel, then gradually rose selling between $120 per barrel and $100 per barrel until the latter half of 2014. Many argue that the reason for the drop in price is to hurt Russia because of their interference in the Ukraine. Others argue that the drop in price is because Saudi Arabia is trying to put the oil sand operation out of business. Whatever the reason — and the true reason will eventually surface in the history books — the question is, "Has the price of oil hit bottom or can it go lower?" There are many exchange traded funds (ETFs) you can follow to help you answer this question. Being a practical person, I chose the ETF iPath S&P GSCI Crude Oil Total Return with the ticker symbol OIL. |

|
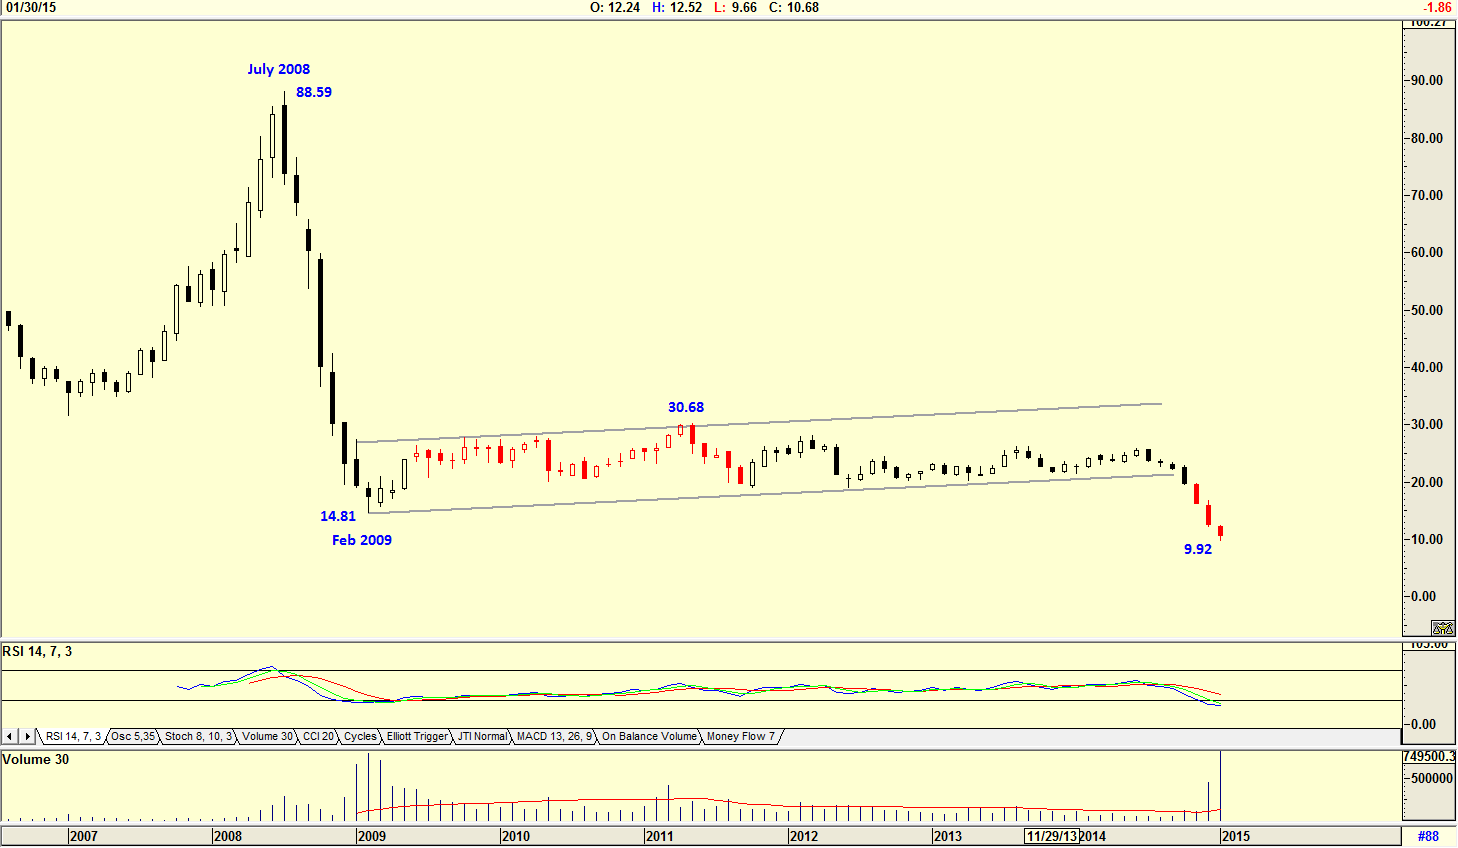
| Figure 1. Monthly Chart. On this monthly chart of OIL you see how price fell from a high of $88.59 in July 2008 to $9.92. The price had fallen on strong volume which is a bearish sign. |
| Graphic provided by: AdvancedGET. |
| |
| In the monthly chart of OIL in Figure 1 you see how the ETF fell from a high of $88.59 in July 2008 to its present price of $9.92. The chart shows the price has fallen on strong volume, which is a bearish sign. The relative strength index (RSI) is at oversold levels, but has not given a buy signal. |

|
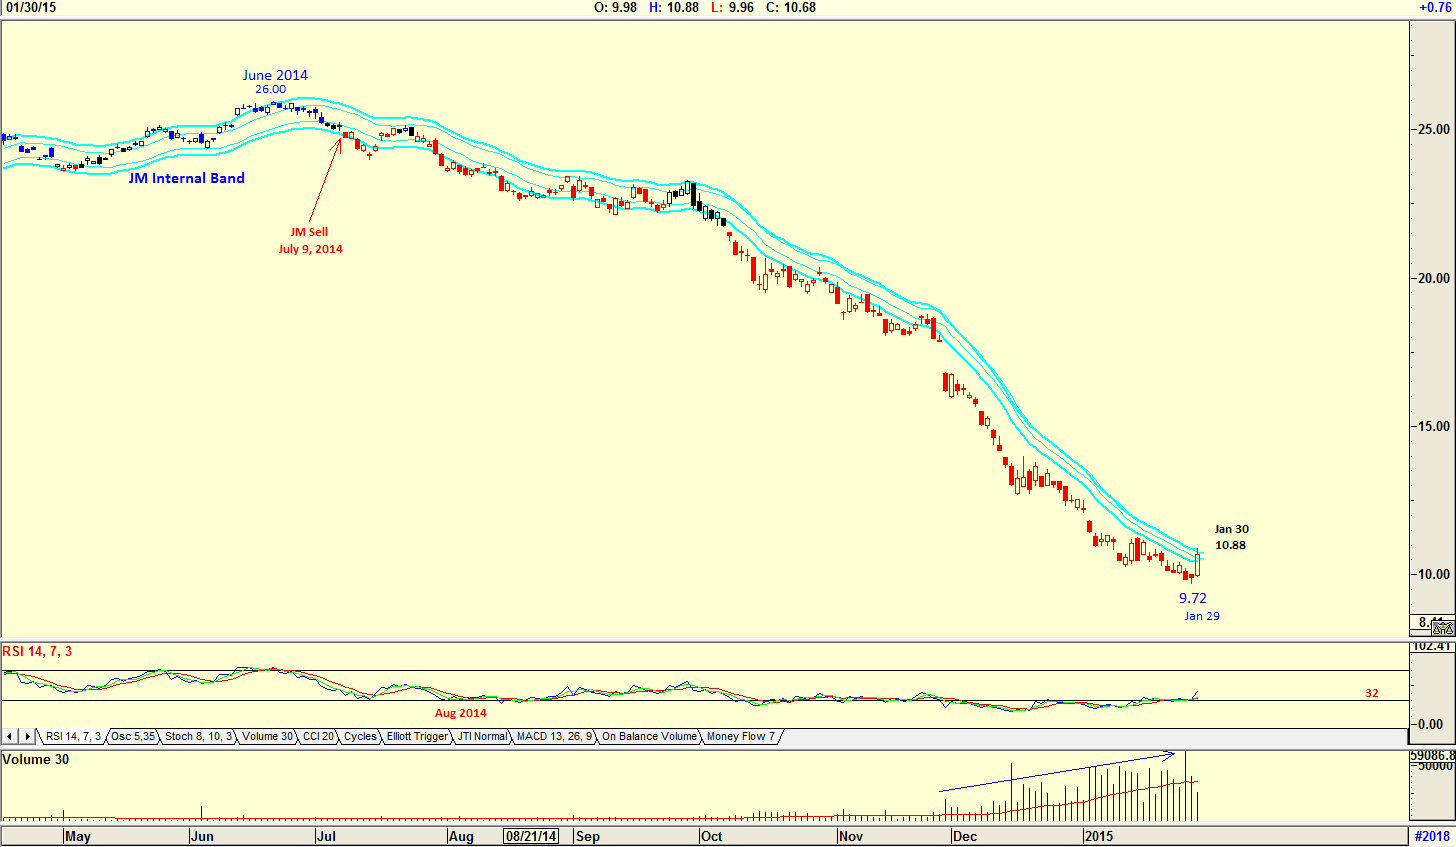
| Figure 2. Daily Chart. Still waiting for a move above the upper JM internal band before considering buying oil. |
| Graphic provided by: AdvancedGET. |
| |
| The chart in Figure 2 is a daily chart showing how the ETF has fallen from a high of $26 in June 2014 to a low of $9.72 by January 29, 2015. The JM Internal band gave a sell signal on July 9, 2014. Since then the share price has not given a buy signal by breaking above the upper JM internal band. A JM internal band is a 15-period simple moving average offset by 2% positive and 2% negative. A move below the lower band is a sell signal, and a move above the upper band a buy signal. The RSI has been at oversold levels since August 2014, and although numerous buy signals were given as the indicator broke above the 32 horizontal line, none were successful. Since December 2014, volume has been rising as the share price fell, which is a bearish sign. On January 30, the price rose to $10.88, but volume fell, which is a bearish sign, and the price tested, but did not break the upper JM internal band. There are many ETFs that track the price of oil and a look at all of them to decide when oil will bottom is a challenge. The ETF that I have used as an example is a helpful guide and is one to keep an eye on. However, I would only be a buyer when the price breaks above the upper JM internal band and on rising volume. |
Has been a technical analyst since 1969, and has worked as a futures and options trader with First Financial Futures in Johannesburg, South Africa.
| Address: | 3256 West 24th Ave |
| Vancouver, BC | |
| Phone # for sales: | 6042634214 |
| E-mail address: | petroosp@gmail.com |
Click here for more information about our publications!
Comments
Date: 02/22/15Rank: 5Comment:

|

Request Information From Our Sponsors
- StockCharts.com, Inc.
- Candle Patterns
- Candlestick Charting Explained
- Intermarket Technical Analysis
- John Murphy on Chart Analysis
- John Murphy's Chart Pattern Recognition
- John Murphy's Market Message
- MurphyExplainsMarketAnalysis-Intermarket Analysis
- MurphyExplainsMarketAnalysis-Visual Analysis
- StockCharts.com
- Technical Analysis of the Financial Markets
- The Visual Investor
- VectorVest, Inc.
- Executive Premier Workshop
- One-Day Options Course
- OptionsPro
- Retirement Income Workshop
- Sure-Fire Trading Systems (VectorVest, Inc.)
- Trading as a Business Workshop
- VectorVest 7 EOD
- VectorVest 7 RealTime/IntraDay
- VectorVest AutoTester
- VectorVest Educational Services
- VectorVest OnLine
- VectorVest Options Analyzer
- VectorVest ProGraphics v6.0
- VectorVest ProTrader 7
- VectorVest RealTime Derby Tool
- VectorVest Simulator
- VectorVest Variator
- VectorVest Watchdog
