HOT TOPICS LIST
- MACD
- Fibonacci
- RSI
- Gann
- ADXR
- Stochastics
- Volume
- Triangles
- Futures
- Cycles
- Volatility
- ZIGZAG
- MESA
- Retracement
- Aroon
INDICATORS LIST
LIST OF TOPICS
PRINT THIS ARTICLE
by Donald W. Pendergast, Jr.
After declining by more than 58% since late June 2014, shares of the United States Oil Fund are getting close to a major multicycle low.
Position: N/A
Donald W. Pendergast, Jr.
Freelance financial markets writer and online publisher of the Trendzetterz.com S&P 500 Weekly Forecast service.
PRINT THIS ARTICLE
CYCLES
USO: Multimonth Decline Fading, Reversal Due
02/02/15 05:27:03 PMby Donald W. Pendergast, Jr.
After declining by more than 58% since late June 2014, shares of the United States Oil Fund are getting close to a major multicycle low.
Position: N/A
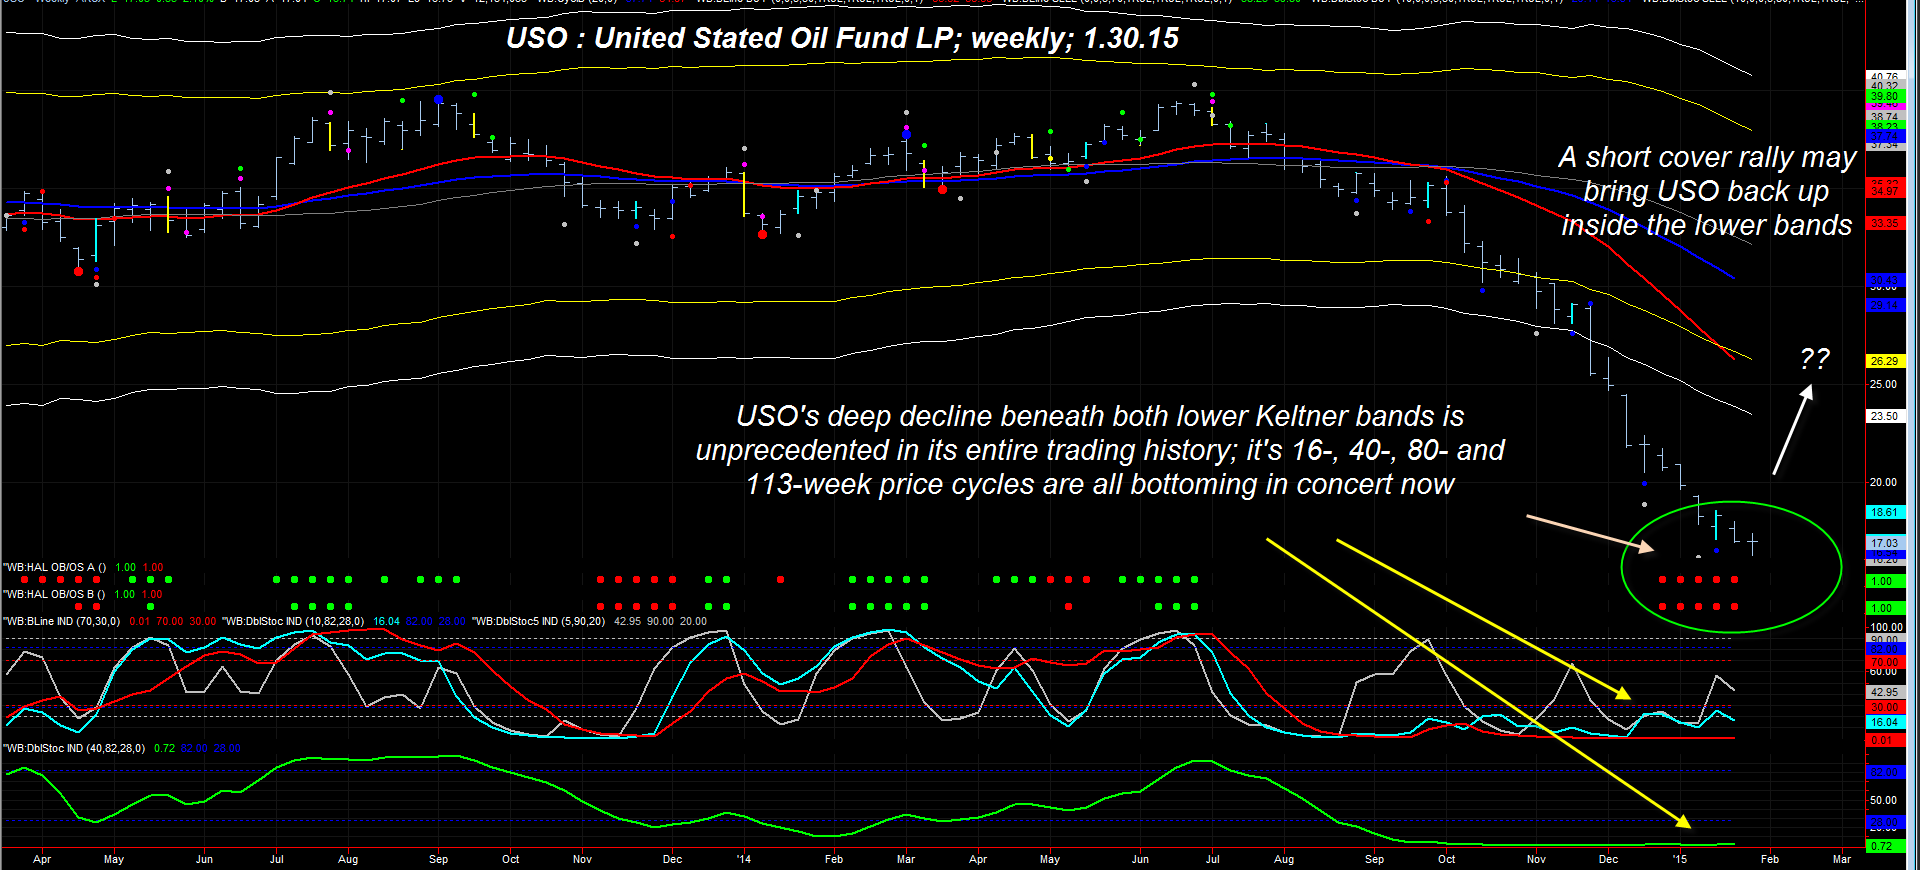
| For the third time in a seven-year span, crude oil is enmeshed in a fairly rare, spectacular trending move — one that continues to amaze consumers, oil producers, and retail and institutional traders alike with its speed and directional persistence. Bearish, extremely dire predictions concerning the future of crude's pricing/supply/demand equation are popular in blog posts, at cocktail parties and the financial news media now, and that is just one of several early warning signs that the current phase of this big energy sector bear market is at or near a bullish reversal point. Here's a closer look now, using a weekly cycles chart (Figure 1) of the United States Oil Fund (USO). |

|
| Figure 1. United States Oil Fund LP (USO). With four significant price cycles at or near a major low at a time of incredible statistical price decline, the risk of a short covering rally grows more likely every day. |
| Graphic provided by: TradeStation. |
| Graphic provided by: ProfitTrader7 from www.walterbressert.com. |
| |
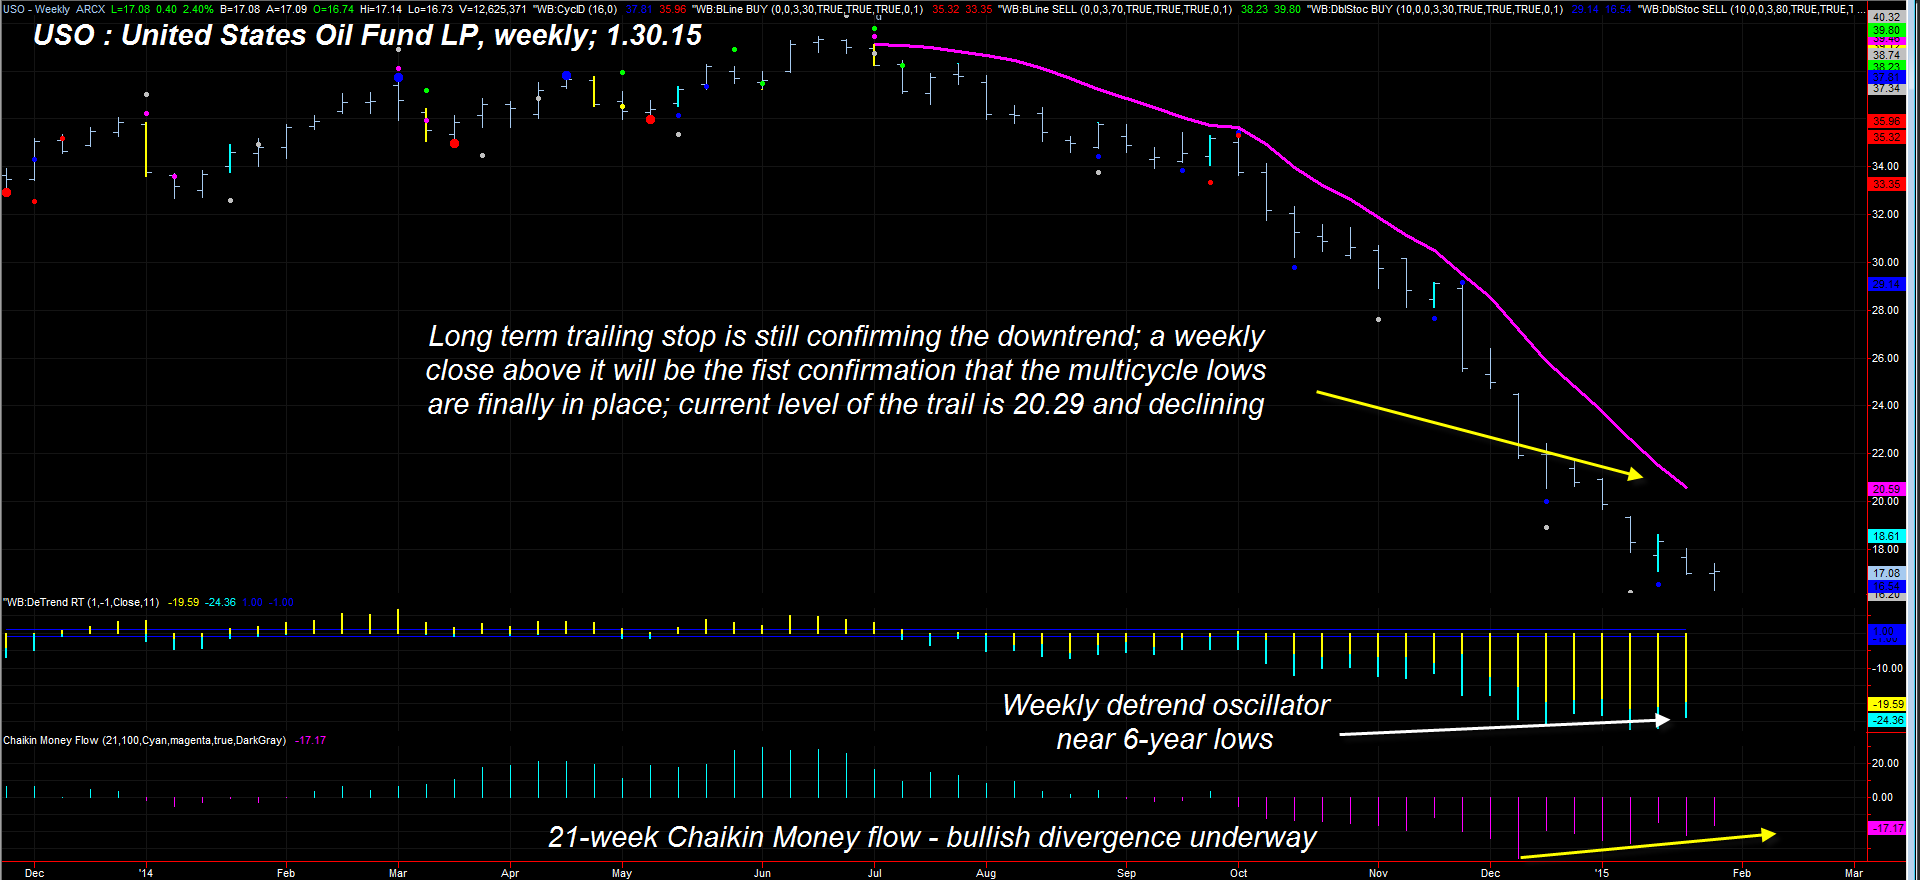
| The dominant weekly price cycle for USO comes in at 16 bars (trough to trough) and the next most repetitive cycle occurs at 113 bar intervals. Then there are the nominal 40- and 80-week cycles, which also exert periodic influence, and at the moment, all four of these major cycles are bottoming simultaneously on USO's weekly chart. Now of course, cycles can expand or contract and it's clear that some of the mentioned cycles have lengthened as this historic move has gained momentum, but when you look at the other technical evidence I will present, you'll see why these multiple cycle lows take on much greater significance. By the way, price cycles are the single most important dynamic driving all trending moves (bullish and bearish), so ignore them at your own peril. 1. The weekly detrend oscillator is at its lowest level in nearly six years, which is when the epic, post-$147 crude oil crash of 2008-2009 finally ended, with crude finally cratering below $35 per barrel. 2. USO continues to stretch unbelievably far beneath its lower Keltner bands, more than on any decline on record for this popular ETF. 3. The cycles algorithm in the ProfitTrader 7 software now forecasts that USO — if it rallies within the next two weeks — may make its next 16-bar cycle high by March 13, 2015 as the cycle transitions from a bearish to a bullish phase. 4. The 21-week Chaikin money flow histogram confirms that the "smart money" are beginning to cover short positions even as they begin adding new long positions in USO. 5. Elliott wave analysis on USO's daily chart (not shown) also reveals that this ETF is in a wave v of 5 decline that is already at or near its nominal price target of 15.00 to 17.00. 6. The spread between four key weekly moving averages in USO reveal that bearish momentum is waning; this is always a precursor to a significant bullish reversal. Existing shorts in USO need to consider taking active steps to limit the damage of a short-covering rally (taking some profits now is a great way to protect against this) and bullish traders need to wait for signs of final capitulation along with a powerful weekly bullish reversal price bar before considering going long on the daily time frame. The weekly chart is still confirming a downtrend (Figure 2). |

|
| Figure 2. The Trend Is Still Down. USO's long-term trailing stop is still confirming the huge multi-month downtrend; note however the extreme oversold detrend oscillator reading and bullish money flow divergence. |
| Graphic provided by: TradeStation. |
| Graphic provided by: ProfitTrader7 from www.walterbressert.com. |
| |
| Although the technical evidence does imply a high-probability trend reversal (especially for those who trade USO on a daily time frame) for crude oil prices, there is a ton of overhead share supply that the bulls are going to have to overcome before USO can make it back up toward the 22.50 - 25.00 level, unless there is a truly massive short covering rally coming soon. Another factor that favors low oil prices for the long haul is the global trend toward deflation — already well underway — which continues to wreak devastating, long-term effects on all advanced economies that carry enormous government, corporate, and private household debt burdens (the US, Europe and Japan in particular). This does not bode well for healthy increases in consumer spending of discretionary items, and with businesses producing less goods and services, the demand for crude oil to run factories will likely remain weak until the root causes of deflation (too much money and credit chasing an oversupply of goods & services) are properly acknowledged and dealt with in a responsible manner. Don't hold your breath waiting for this to occur anytime soon! John Q. Public and Suzy D. Homemaker may not appreciate those market deflation dynamics though; after all, what's not to like now that you can fill up your car for less than half of what it cost a year ago. |
Freelance financial markets writer and online publisher of the Trendzetterz.com S&P 500 Weekly Forecast service.
| Title: | Market consultant and writer |
| Company: | Trendzetterz |
| Address: | 81 Hickory Hollow Drive |
| Crossville, TN 38555 | |
| Phone # for sales: | 904-303-4814 |
| Website: | trendzetterz.com |
| E-mail address: | support@trendzetterz.com |
Traders' Resource Links | |
| Trendzetterz has not added any product or service information to TRADERS' RESOURCE. | |
Click here for more information about our publications!
PRINT THIS ARTICLE

Request Information From Our Sponsors
- StockCharts.com, Inc.
- Candle Patterns
- Candlestick Charting Explained
- Intermarket Technical Analysis
- John Murphy on Chart Analysis
- John Murphy's Chart Pattern Recognition
- John Murphy's Market Message
- MurphyExplainsMarketAnalysis-Intermarket Analysis
- MurphyExplainsMarketAnalysis-Visual Analysis
- StockCharts.com
- Technical Analysis of the Financial Markets
- The Visual Investor
- VectorVest, Inc.
- Executive Premier Workshop
- One-Day Options Course
- OptionsPro
- Retirement Income Workshop
- Sure-Fire Trading Systems (VectorVest, Inc.)
- Trading as a Business Workshop
- VectorVest 7 EOD
- VectorVest 7 RealTime/IntraDay
- VectorVest AutoTester
- VectorVest Educational Services
- VectorVest OnLine
- VectorVest Options Analyzer
- VectorVest ProGraphics v6.0
- VectorVest ProTrader 7
- VectorVest RealTime Derby Tool
- VectorVest Simulator
- VectorVest Variator
- VectorVest Watchdog
