HOT TOPICS LIST
- MACD
- Fibonacci
- RSI
- Gann
- ADXR
- Stochastics
- Volume
- Triangles
- Futures
- Cycles
- Volatility
- ZIGZAG
- MESA
- Retracement
- Aroon
INDICATORS LIST
LIST OF TOPICS
PRINT THIS ARTICLE
by Koos van der Merwe
With the anticipated rise in the gold price and gold shares should there be a war in Iraq, many gold shares are beginning to look promising. One of the 'shares' that has already given a buy signal is the XGD or S&P/TSE Canada Gold Index that is traded on the Toronto Stock Exchange.
Position: Buy
Koos van der Merwe
Has been a technical analyst since 1969, and has worked as a futures and options trader with First Financial Futures in Johannesburg, South Africa.
PRINT THIS ARTICLE
MOVING AVERAGES
S&P/TSE Canada Gold Index
11/08/02 11:48:18 AMby Koos van der Merwe
With the anticipated rise in the gold price and gold shares should there be a war in Iraq, many gold shares are beginning to look promising. One of the 'shares' that has already given a buy signal is the XGD or S&P/TSE Canada Gold Index that is traded on the Toronto Stock Exchange.
Position: Buy
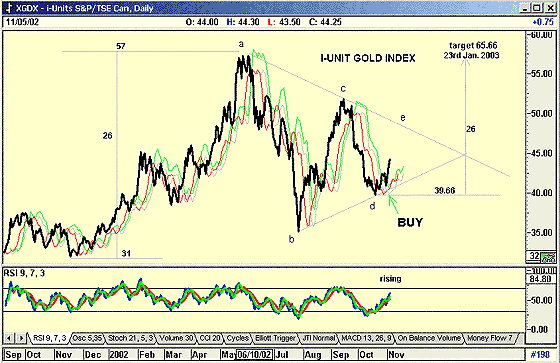
| The chart below is of the S&P/TSE Canada Gold Index, more commonly known as the Gold I-Unit Index. I have included the Red/Green strategy to determine performance. (See my article, "Red/Green Strategy" posted on September 30, 2002.) |
| I-Units, the Canadian equivalent of exchange traded funds (ETFs), are traded on the Toronto Stock exchange. I use them as a good indicator of sector direction because they incorporate sophisticated investor sentiment due to their high price, presently at $44.75. This high price discourages penny pinchers or speculators from distorting performance. |

|
| S&P TSE Canada Gold Index |
| Graphic provided by: AdvancedGET. |
| |
| The chart shows that a buy signal was given on the October 28, 2002, when the I-Unit crossed above the green line (the high of ten days ago). This has been confirmed by the RSI indicator which is bullish and rising. |
| To determine an estimated target value, I have drawn a consolidation triangle, and labeled it accordingly (see "Anyone for Gold?", October 29, 2002 ). Do note that the triangle strategy I used is the original classic strategy, not the strategy found in Elliott wave analysis. |
| Using this strategy, I find that should the I-Unit break out of the triangle at 'e' which is a possibility considering the recent strength in gold, the price could rise to 65.66 before falling back. The estimated date of the triangle apex is January 21, 2003. |
Has been a technical analyst since 1969, and has worked as a futures and options trader with First Financial Futures in Johannesburg, South Africa.
| Address: | 3256 West 24th Ave |
| Vancouver, BC | |
| Phone # for sales: | 6042634214 |
| E-mail address: | petroosp@gmail.com |
Click here for more information about our publications!
Comments

Request Information From Our Sponsors
- VectorVest, Inc.
- Executive Premier Workshop
- One-Day Options Course
- OptionsPro
- Retirement Income Workshop
- Sure-Fire Trading Systems (VectorVest, Inc.)
- Trading as a Business Workshop
- VectorVest 7 EOD
- VectorVest 7 RealTime/IntraDay
- VectorVest AutoTester
- VectorVest Educational Services
- VectorVest OnLine
- VectorVest Options Analyzer
- VectorVest ProGraphics v6.0
- VectorVest ProTrader 7
- VectorVest RealTime Derby Tool
- VectorVest Simulator
- VectorVest Variator
- VectorVest Watchdog
- StockCharts.com, Inc.
- Candle Patterns
- Candlestick Charting Explained
- Intermarket Technical Analysis
- John Murphy on Chart Analysis
- John Murphy's Chart Pattern Recognition
- John Murphy's Market Message
- MurphyExplainsMarketAnalysis-Intermarket Analysis
- MurphyExplainsMarketAnalysis-Visual Analysis
- StockCharts.com
- Technical Analysis of the Financial Markets
- The Visual Investor
