HOT TOPICS LIST
- MACD
- Fibonacci
- RSI
- Gann
- ADXR
- Stochastics
- Volume
- Triangles
- Futures
- Cycles
- Volatility
- ZIGZAG
- MESA
- Retracement
- Aroon
INDICATORS LIST
LIST OF TOPICS
PRINT THIS ARTICLE
by Donald W. Pendergast, Jr.
Twitter shares may be prepping for further gains, now that a solid basing pattern is in place.
Position: N/A
Donald W. Pendergast, Jr.
Freelance financial markets writer and online publisher of the Trendzetterz.com S&P 500 Weekly Forecast service.
PRINT THIS ARTICLE
CYCLES
TWTR : Potential For Bullish Reversal
01/21/15 12:48:10 PMby Donald W. Pendergast, Jr.
Twitter shares may be prepping for further gains, now that a solid basing pattern is in place.
Position: N/A
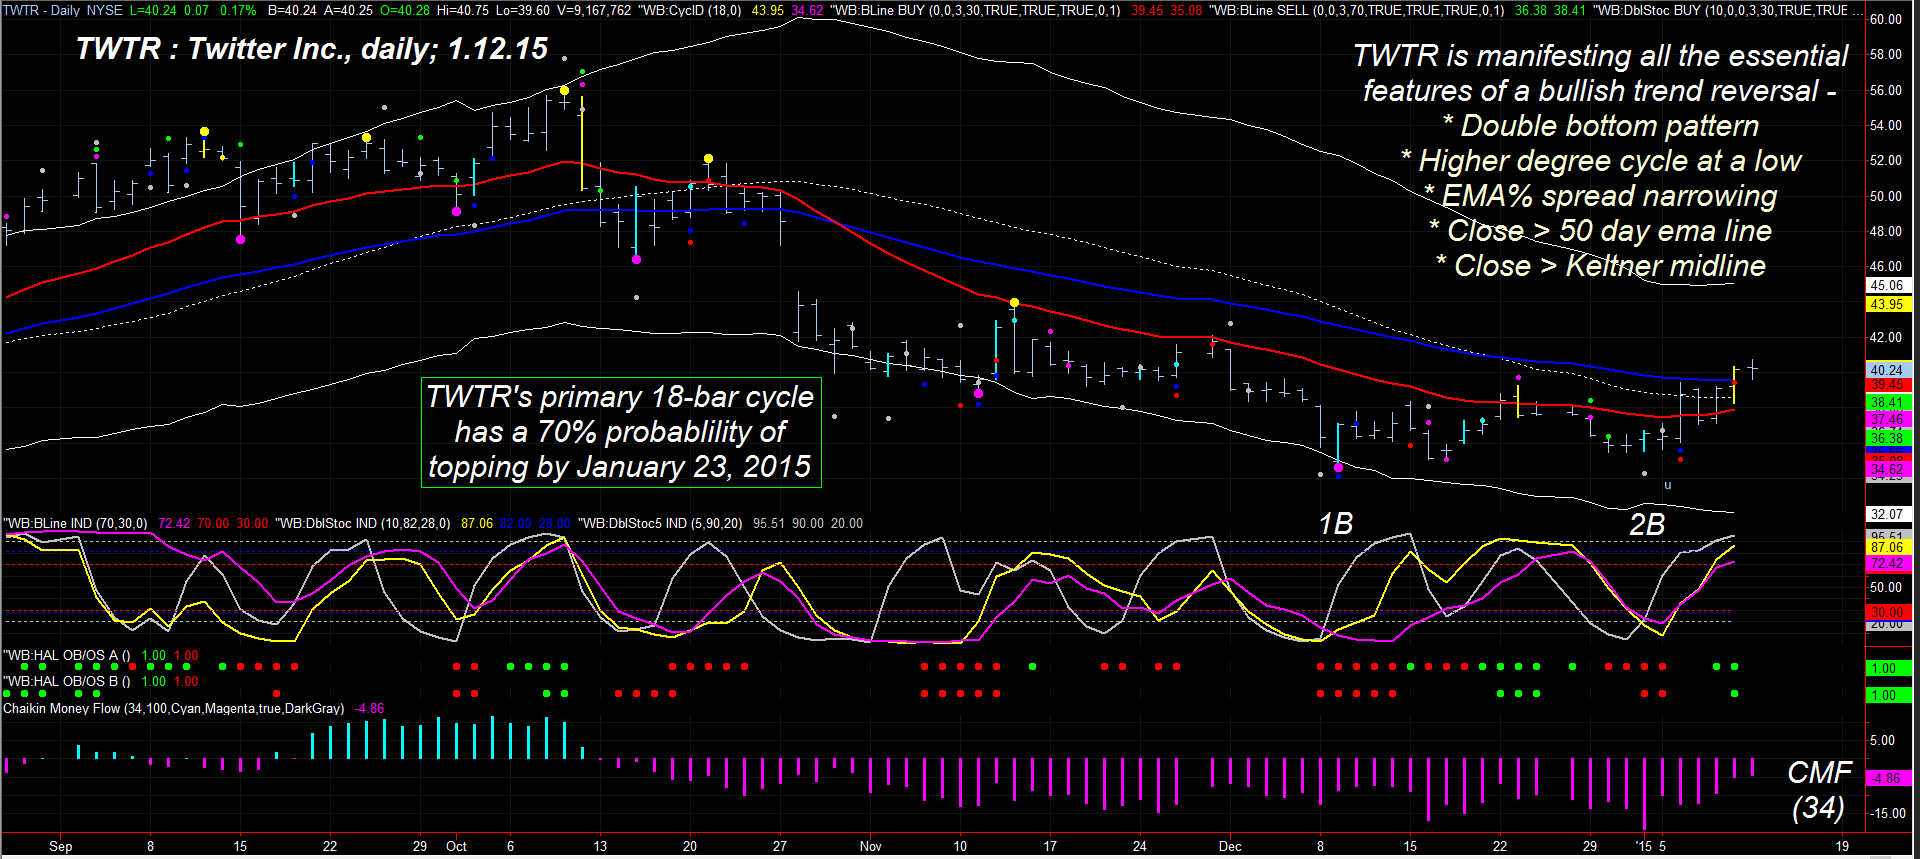
| Although the stock market as a whole still looks vulnerable to an even deeper correction, shares of Twitter (TWTR) may be well into the early stages of a bullish trend reversal; here's a closer look now at the key cycles and trend dynamics that are at work on TWTR's daily chart (Figure 1). |

|
| Figure 1. Daily Chart Of Twitter Inc. (TWTR). Shares of this major social networking stock are in a confirmed bullish reversal, but traders need to be aware of the open gap from late October '2014, which may act as a major resistance level. |
| Graphic provided by: TradeStation. |
| Graphic provided by: ProfitTrader7 from www.walterbressert.com. |
| |
| Because TWTR has only been trading on the stock market since November 2013, there is enough daily (but not weekly) historical data to begin to plot the dominant price cycles driving this issue; at present, a pair of 18-bar and 48-bar cycles are the main movers in this social networker's price movements, and with both cycles having bottomed together, the odds for more upside in the stock look promising. In addition, there are other key technicals that are also suggesting that TWTR has more gains ahead in January 2015: 1. The well-proportioned double bottom pattern (1B, 2B) is a dead giveaway that a reversal attempt is underway, especially with the 18- and 48-day cycles now rising. 2. Money flow continues to improve at a modest clip, based on the 34-bar Chaikin money flow histogram (CMF)(34). 3. The spread between the red and blue exponential moving average lines (EMA) continues to narrow. 4. TWTR has managed to close back above its 50-bar EMA and the Keltner band midline (white dashed line). 5. The cycle forecast algorithm in the ProfitTrader 7 software projects a 70% probability that TWTR's 18-bar cycle will top by January 23, 2015 and that there is a 30% chance that the top will occur after that date. 6. TWTR's weekly chart also looks to be in a bullish stance; however, there simply isn't enough historical data to produce a statistically meaningful weekly price cycle count. By the final quarter of 2015 there will be enough weekly price bars to begin tracking the cycles in play for the all-important weekly cycles. |

|
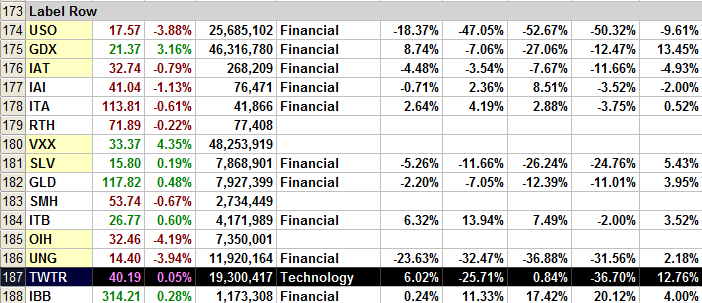
| Figure 2. Comparative Strength. TWTR's comparative relative strength scorecard vs. the S&P 500 index (.SPX) and key sector ETF's is a mixed bag heading into 2015. |
| Graphic provided by: TradeStation. |
| Graphic provided by: TradeStation 9.1 RadarScreen. |
| |
| All in all, this amounts to a bullish near-term equation for Twitter shares; existing longs should run a trailing volatility stop or even a two to three-bar trail of the daily lows until final stop out. Traders should also use a trend line based on the most recent 18-bar cycle low to help warn them of any impending weakness as the cycle top finally plays out. However, should this move go a bit further north than anticipated, be aware of the open gap (since late October 2014) spanning the range from 44.58 to 47.18 as that area will almost surely become a major battle zone between the TWTR bulls & bears. Any move up toward 44.50 should be viewed as a great place to take at least half — if not all — of any open profits accrued, should TWTR continue to power higher. Trade wisely until we meet here again, keeping your portfolio diversified and your account risk at a modest level. |
Freelance financial markets writer and online publisher of the Trendzetterz.com S&P 500 Weekly Forecast service.
| Title: | Market consultant and writer |
| Company: | Trendzetterz |
| Address: | 81 Hickory Hollow Drive |
| Crossville, TN 38555 | |
| Phone # for sales: | 904-303-4814 |
| Website: | trendzetterz.com |
| E-mail address: | support@trendzetterz.com |
Traders' Resource Links | |
| Trendzetterz has not added any product or service information to TRADERS' RESOURCE. | |
Click here for more information about our publications!
PRINT THIS ARTICLE

Request Information From Our Sponsors
- StockCharts.com, Inc.
- Candle Patterns
- Candlestick Charting Explained
- Intermarket Technical Analysis
- John Murphy on Chart Analysis
- John Murphy's Chart Pattern Recognition
- John Murphy's Market Message
- MurphyExplainsMarketAnalysis-Intermarket Analysis
- MurphyExplainsMarketAnalysis-Visual Analysis
- StockCharts.com
- Technical Analysis of the Financial Markets
- The Visual Investor
- VectorVest, Inc.
- Executive Premier Workshop
- One-Day Options Course
- OptionsPro
- Retirement Income Workshop
- Sure-Fire Trading Systems (VectorVest, Inc.)
- Trading as a Business Workshop
- VectorVest 7 EOD
- VectorVest 7 RealTime/IntraDay
- VectorVest AutoTester
- VectorVest Educational Services
- VectorVest OnLine
- VectorVest Options Analyzer
- VectorVest ProGraphics v6.0
- VectorVest ProTrader 7
- VectorVest RealTime Derby Tool
- VectorVest Simulator
- VectorVest Variator
- VectorVest Watchdog
