HOT TOPICS LIST
- MACD
- Fibonacci
- RSI
- Gann
- ADXR
- Stochastics
- Volume
- Triangles
- Futures
- Cycles
- Volatility
- ZIGZAG
- MESA
- Retracement
- Aroon
INDICATORS LIST
LIST OF TOPICS
PRINT THIS ARTICLE
by Alan R. Northam
The expansion and contraction indicators suggest the stock market cycle has now entered into a period of contraction indicating a weakening of the stock market.
Position: N/A
Alan R. Northam
Alan Northam lives in the Dallas, Texas area and as an electronic engineer gave him an analytical mind from which he has developed a thorough knowledge of stock market technical analysis. His abilities to analyze the future direction of the stock market has allowed him to successfully trade of his own portfolio over the last 30 years. Mr. Northam is now retired and trading the stock market full time. You can reach him at inquiry@tradersclassroom.com or by visiting his website at http://www.tradersclassroom.com. You can also follow him on Twitter @TradersClassrm.
PRINT THIS ARTICLE
CYCLES
Stock Market Contraction Begins
01/16/15 03:05:34 PMby Alan R. Northam
The expansion and contraction indicators suggest the stock market cycle has now entered into a period of contraction indicating a weakening of the stock market.
Position: N/A
| In a perfect world the stock market goes through a period of expansion and contraction every four years — known as the market cycle. In the real world however, the stock market may extend this cycle to eight or 12 years. During the market cycle, certain stocks within the Dow Jones Industrial Average (DJIA) perform best during periods of expansion while others perform best during contractions. In order to monitor when the stock market is expanding and when it is contracting I have created two indicators that I monitor on a regular basis. One indicator represents the period when the stock market is expanding and the other when it is contracting. To create these two indicators I have used the individual stock holdings of the DJIA. I have separated these stocks into two groups — one that performs best during market expansion and one that performs best during market contraction. I then compared each of these two groups to their price one year ago to determine their year over year or relative performance. The first group of stocks I call the market expansion performance indicator (MEPI). The second group I call the market contraction performance indicator (MCPI). |

|
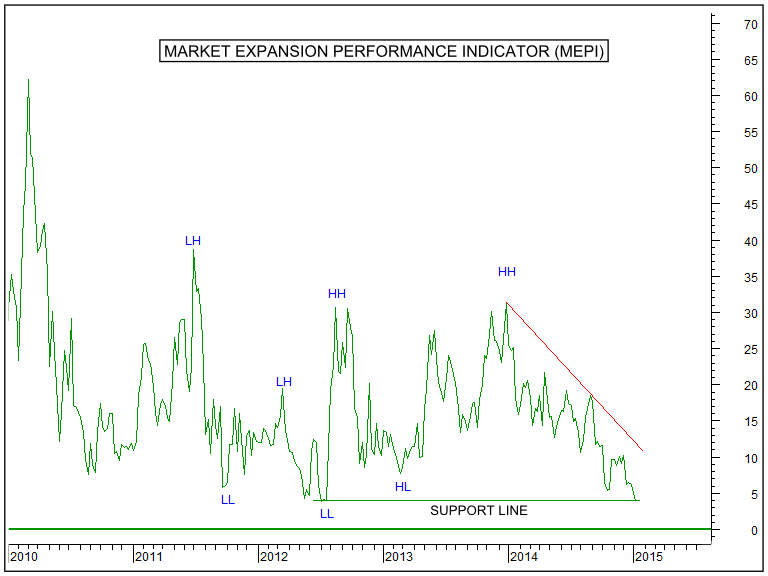
| Figure 1. Market Expansion Performance Indicator (MEPI). Here you see the weekly line chart of a basket of DJIA stocks that perform best during market expansions. When the line trends upward market expansion is strengthening. When the line trends downward market expansion is weakening. |
| Graphic provided by: MetaStock. |
| Graphic provided by: Graphic provided by: Serif DrawPlus X3 Graphics St. |
| |
| Figure 1 shows a weekly line chart of the MEPI. This indicator is currently reading 3.4 indicating that the group of DJIA stocks that perform best during market expansions is up by 3.4% over the last 12 months. Figure 1 further shows the MEPI made lower highs (LH) and lower lows (LL) from 2010 through mid-2012 indicating a downward trend or weakening of the expansionary period of the market cycle. This indicator then made a new higher high (HH) in mid-2012 to end this downward trend. In early 2013 the MEPI then made a higher low (HL) to indicate the beginning of a new upward trend and then rallied to a new higher high (HH) at the beginning of 2014 to confirm this new upward trend. Following the newly established upward trend, the MEPI failed to continue to rally higher and declined throughout 2014 indicating a year long weakening of the expansionary phase of the market cycle. A break down to a new lower low (LL) would signal the beginning of a new downward trend and a break down to below zero would put an end to the expansionary phase of the market cycle. |

|
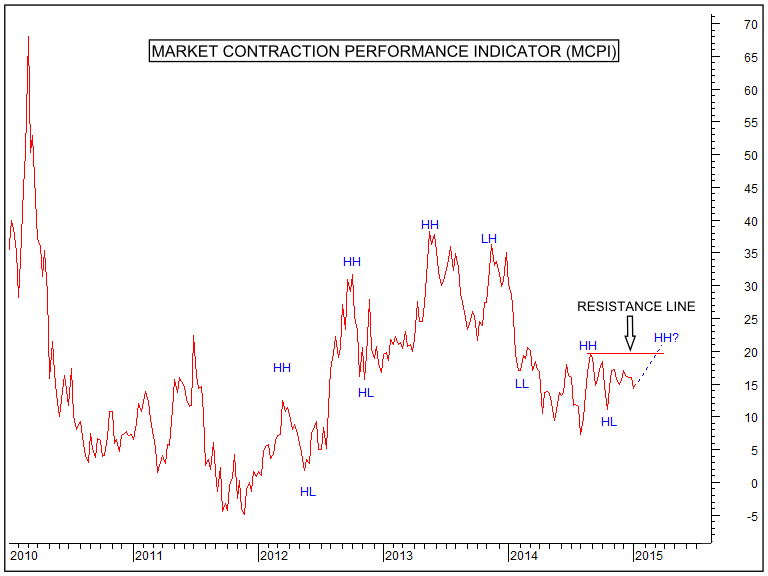
| Figure 2. Market Contraction Performance Indicator (MCPI). Here you see the weekly line chart of a basket of DJIA stocks that perform best during market contractions. All DJIA stocks that perform best during periods of market contraction are up 15.1% over the last 12-month period. |
| Graphic provided by: MetaStock. |
| Graphic provided by: Graphic provided by: Serif DrawPlus X3 Graphics St. |
| |
| Figure 2 shows a weekly line chart of the market contraction performance indicator (MCPI). This indicator is currently reading 15.1 indicating the MCPI is 15.1% higher than it was one year ago. This indicates that the collection of DJIA stocks that perform best during periods of market contraction is up 15.1% over the last 12-month period. Figure 2 also shows the MCPI made higher highs (HH) and higher lows (HL) from 2012 through mid-2013 indicating an upward trend and a strengthening period of contraction within the market cycle. This indicator then made a lower high (LH) in late 2013 and a lower low (LL) in early 2014 to end the upward trend of market contraction and the beginning of a new downward trend or weakening of the period of contraction within the market cycle. In late 2014 the MCPI once again made a higher high (HH) and a higher low (HL) to end the downward trend. A new higher high (HH) is now required to confirm that a new upward trend, or strengthening, in market contraction is underway. |
| When you compare Figure 1 to Figure 2 you see the MEPI is currently trending in a downward direction indicating that the stock market is not expanding. You also see the MCPI has ended its downward trend but has not yet confirmed a new upward trend to indicate a contracting market. Thus, it appears that at the current time, the stock market is neither expanding nor contracting. Therefore, it could be an indication that the stock market is at its peak. By closer examination of Figure 1 you notice that should the MEPI break down below the support line and ultimately below zero it would indicate the market is no longer expanding. By closer examination of Figure 2 we also see that a breakout to a new higher high would indicate a strengthening of contraction within the market. Further, notice the MEPI is at 4.8% while the MCPI is at 16.4%. This indicates stocks that perform best during market contractions are doing better than those that perform best during market expansions. Thus, we can conclude that a period of market contraction is already underway even though the trend of the MEPI and the MCPI does not yet confirm this action. |
| By dividing the stocks within the DJIA into two groups, one that performs best during periods when the stock market is expanding and one that performs best when the market is contracting, it is possible to gain a perspective as to whether the market cycle is expanding or contracting. This analysis suggests that the stock market is now at its peak and is starting to contract. Having gained this perspective of the stock market cycle, traders can now make informed trading decisions as to whether to trade stocks that perform best during market cycle expansions or to trade those stocks that perform best during market cycle contractions. |
Alan Northam lives in the Dallas, Texas area and as an electronic engineer gave him an analytical mind from which he has developed a thorough knowledge of stock market technical analysis. His abilities to analyze the future direction of the stock market has allowed him to successfully trade of his own portfolio over the last 30 years. Mr. Northam is now retired and trading the stock market full time. You can reach him at inquiry@tradersclassroom.com or by visiting his website at http://www.tradersclassroom.com. You can also follow him on Twitter @TradersClassrm.
| Garland, Tx | |
| Website: | www.tradersclassroom.com |
| E-mail address: | inquiry@tradersclassroom.com |
Click here for more information about our publications!
Comments
Date: 01/24/15Rank: 5Comment:

Request Information From Our Sponsors
- StockCharts.com, Inc.
- Candle Patterns
- Candlestick Charting Explained
- Intermarket Technical Analysis
- John Murphy on Chart Analysis
- John Murphy's Chart Pattern Recognition
- John Murphy's Market Message
- MurphyExplainsMarketAnalysis-Intermarket Analysis
- MurphyExplainsMarketAnalysis-Visual Analysis
- StockCharts.com
- Technical Analysis of the Financial Markets
- The Visual Investor
- VectorVest, Inc.
- Executive Premier Workshop
- One-Day Options Course
- OptionsPro
- Retirement Income Workshop
- Sure-Fire Trading Systems (VectorVest, Inc.)
- Trading as a Business Workshop
- VectorVest 7 EOD
- VectorVest 7 RealTime/IntraDay
- VectorVest AutoTester
- VectorVest Educational Services
- VectorVest OnLine
- VectorVest Options Analyzer
- VectorVest ProGraphics v6.0
- VectorVest ProTrader 7
- VectorVest RealTime Derby Tool
- VectorVest Simulator
- VectorVest Variator
- VectorVest Watchdog
