HOT TOPICS LIST
- MACD
- Fibonacci
- RSI
- Gann
- ADXR
- Stochastics
- Volume
- Triangles
- Futures
- Cycles
- Volatility
- ZIGZAG
- MESA
- Retracement
- Aroon
INDICATORS LIST
LIST OF TOPICS
PRINT THIS ARTICLE
by Koos van der Merwe
When an Elliott wave count synchronizes with an indicator does it mean it is time to buy the stock?
Position: Accumulate
Koos van der Merwe
Has been a technical analyst since 1969, and has worked as a futures and options trader with First Financial Futures in Johannesburg, South Africa.
PRINT THIS ARTICLE
TECHNICAL ANALYSIS
Is It Time To Look At DDD Again?
01/26/15 04:37:29 PMby Koos van der Merwe
When an Elliott wave count synchronizes with an indicator does it mean it is time to buy the stock?
Position: Accumulate
| Three Dimensional Printing (DDD) shares have fallen badly over the past year. Has DDD not met the expectations of the enthusiasts, or has the company been badly mismanaged? Whatever the reason, it is not for a technical analyst to ask. A chartist must simply look at the charts, and allow the indicators and chart patterns to tell them what is happening to the share. The charts seem to pick up what those in the know are doing. |

|
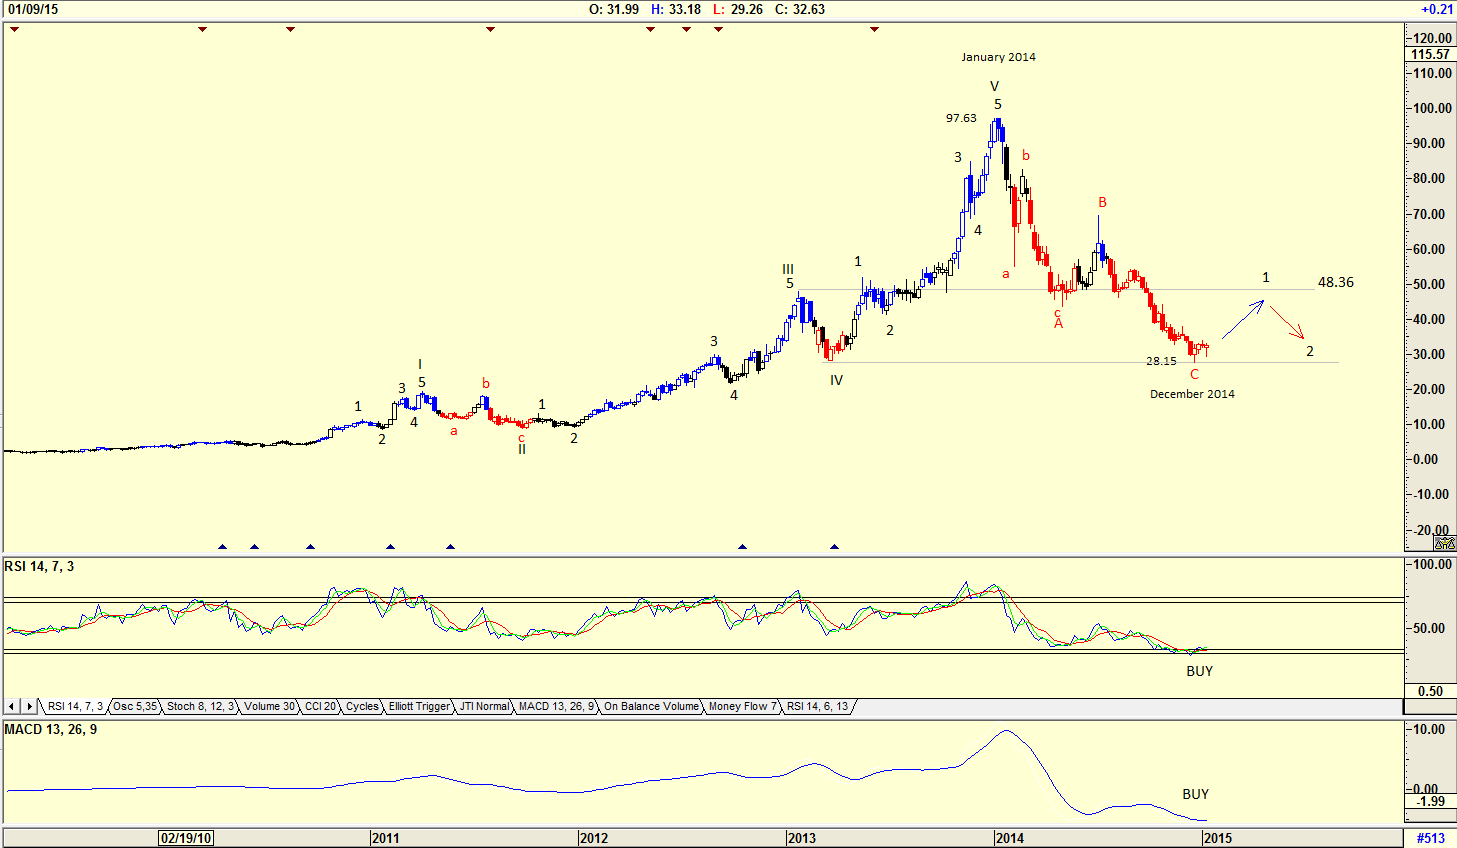
| Figure 1. Weekly Chart With Elliott Wave Count. The ABC correction has fallen to a WAVE IV. The Wave 1 up that should now follow the ABC correction could find resistance at $48.36. |
| Graphic provided by: AdvancedGET. |
| |
| The chart in Figure 1 is a weekly chart of DDD showing how over the past year (2014), the share price has fallen from a high of $97.63 in January 2014 to a low of $28.15 by December 2014. That was not a very progressive year, technically speaking. However, the Elliott wave count looks perfect. One of the definitions of Elliott wave analysis is that the count must look correct. The ABC correction has fallen to WAVE IV and the relative strength index (RSI) and MACD indicators are both suggesting a buy. The Wave 1 up that should now follow the ABC correction could find resistance at $48.36, a level triggered by support & resistance as shown on the chart. The Wave 2 that will follow the Wave 1 could be a 50% to 72% correction, hopefully less. So, is it now time to start buying the share? The weekly chart suggests that it is. What does the daily chart say? |

|
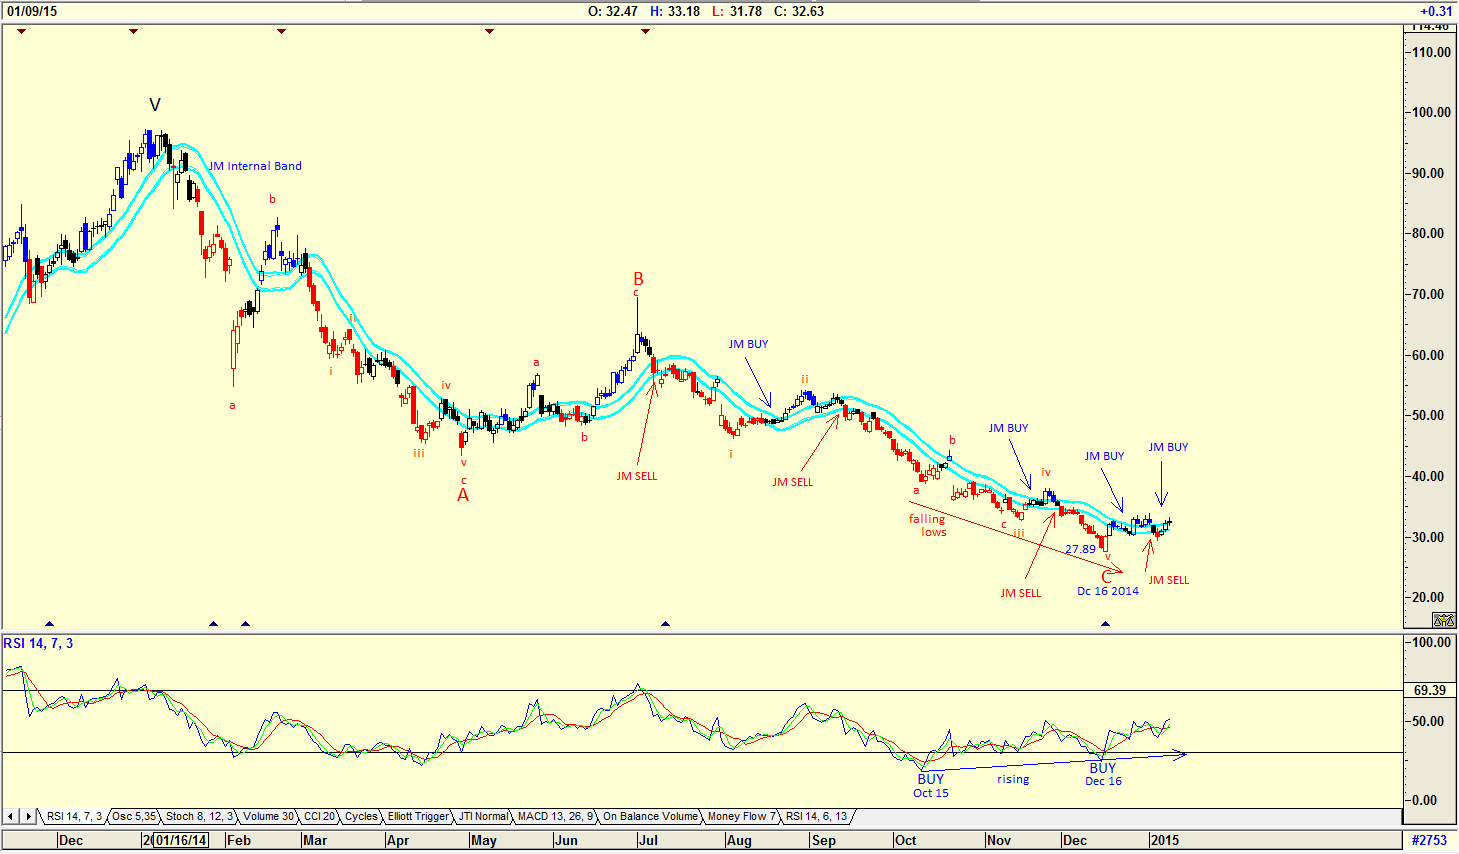
| Figure 2. Daily Chart Suggesting A Divergence Buy Signal. The daily chart suggests a strong divergence RSI buy signal. |
| Graphic provided by: AdvancedGET. |
| |
| The chart in Figure 2 is a daily chart with the ABC correction suggested in the weekly chart of Figure 1. The C-wave suggested looks correct, however the RSI having given an unsuccessful buy signal on October 15, 2014 makes you wonder whether the buy signal of December 16, 2014 signal is safe. Looking at the signals however, it does look like a divergence buy signal. A divergence buy signal is where the low of the RSI buy signals are rising, whereas the low of the stock price is falling. What is also disturbing is the JM Internal Band buy signals that also failed. The JM Internal Band indicator is a 15-period simple moving average offset by 2% positive and 2% negative. A move above the upper band suggests a buy and below the lower band a sell. With the weekly chart, suggesting the start of a new bull trend, and the daily chart suggesting that a strong divergence RSI buy signal was given on December 16, 2014 you could well take the risk and start accumulating the shares of DDD for a long-term hold. |
Has been a technical analyst since 1969, and has worked as a futures and options trader with First Financial Futures in Johannesburg, South Africa.
| Address: | 3256 West 24th Ave |
| Vancouver, BC | |
| Phone # for sales: | 6042634214 |
| E-mail address: | petroosp@gmail.com |
Click here for more information about our publications!
PRINT THIS ARTICLE

Request Information From Our Sponsors
- StockCharts.com, Inc.
- Candle Patterns
- Candlestick Charting Explained
- Intermarket Technical Analysis
- John Murphy on Chart Analysis
- John Murphy's Chart Pattern Recognition
- John Murphy's Market Message
- MurphyExplainsMarketAnalysis-Intermarket Analysis
- MurphyExplainsMarketAnalysis-Visual Analysis
- StockCharts.com
- Technical Analysis of the Financial Markets
- The Visual Investor
- VectorVest, Inc.
- Executive Premier Workshop
- One-Day Options Course
- OptionsPro
- Retirement Income Workshop
- Sure-Fire Trading Systems (VectorVest, Inc.)
- Trading as a Business Workshop
- VectorVest 7 EOD
- VectorVest 7 RealTime/IntraDay
- VectorVest AutoTester
- VectorVest Educational Services
- VectorVest OnLine
- VectorVest Options Analyzer
- VectorVest ProGraphics v6.0
- VectorVest ProTrader 7
- VectorVest RealTime Derby Tool
- VectorVest Simulator
- VectorVest Variator
- VectorVest Watchdog
