HOT TOPICS LIST
- MACD
- Fibonacci
- RSI
- Gann
- ADXR
- Stochastics
- Volume
- Triangles
- Futures
- Cycles
- Volatility
- ZIGZAG
- MESA
- Retracement
- Aroon
INDICATORS LIST
LIST OF TOPICS
PRINT THIS ARTICLE
by Gary Grosschadl
The inverse relationship between the volatility index and the direction of the markets is firmly established. What is the VIX saying now?
Position: N/A
Gary Grosschadl
Independent Canadian equities trader and technical analyst based in Peterborough
Ontario, Canada.
PRINT THIS ARTICLE
TECHNICAL ANALYSIS
Volatility Index Examined
11/07/02 09:33:10 AMby Gary Grosschadl
The inverse relationship between the volatility index and the direction of the markets is firmly established. What is the VIX saying now?
Position: N/A
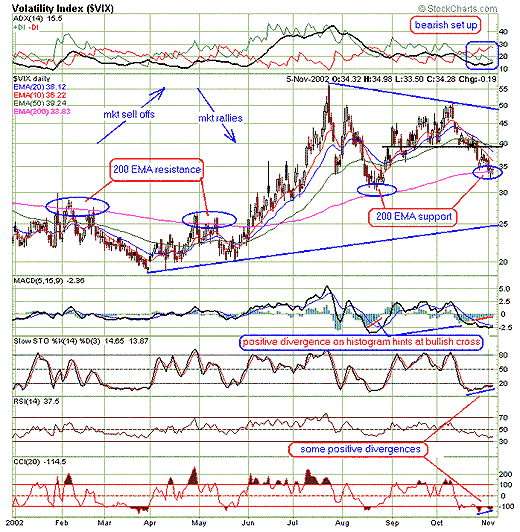
| Since the meltdown of the indices, the nature of the VIX chart in relation to the ever important 200-day EMA has dramatically changed. As the chart shows, what was resistance is now acting as support. This by itself suggests that a reversal is near which would bring the VIX up and the markets correspondingly down. However there are other things to consider. |
| The chart hints that more VIX downside (market upside) is also a possiblity by virtue of the still bearish setup of the DMI (directional movement indicator ADX/DI) at the top of the chart and the appearance of the large triangle. Symmetrical triangles are viewed as neutral as movements flow back and forth until there is an eventual break either way. The nature of this triangle suggests an eventual move down to test lower trendline is as likely as a move up to test upper trendline. |

|
| Graphic provided by: StockCharts.com. |
| |
| The other technical indicator factors to consider (that give credence to the VIX bouncing off the 200-day EMA and rising) are several positive divergences. Note the histogram of the MACD has the negative bars shrinking, which points to a likely bullish crossover of the black MACD line and the blue signal line. Also positive divergences are showing up on stochastics and CCI (commodity channel index). This would give weight to moving up from oversold territory. |
| Whichever way the VIX goes from this likely crucial point in the short-term should be telling as the main indices will surely follow in the inverse direction. I am leaning toward the VIX moving up and the markets moving down but as always the market has the final say. Should the VIX move up, I have drawn a horizontal black line on the chart where I expect to find bigger resistance, based on previous gaps, which also lines up with two overhead moving average lines. So VIX 38-39 should be carefully watched for the possibility of yet another reversal if I have short-term direction correct. |
Independent Canadian equities trader and technical analyst based in Peterborough
Ontario, Canada.
| Website: | www.whatsonsale.ca/financial.html |
| E-mail address: | gwg7@sympatico.ca |
Click here for more information about our publications!
Comments
Date: 11/12/02Rank: 4Comment:
Date: 11/13/02Rank: 5Comment:
Date: 11/17/02Rank: 3Comment:
Date: 11/30/02Rank: 3Comment:

Request Information From Our Sponsors
- StockCharts.com, Inc.
- Candle Patterns
- Candlestick Charting Explained
- Intermarket Technical Analysis
- John Murphy on Chart Analysis
- John Murphy's Chart Pattern Recognition
- John Murphy's Market Message
- MurphyExplainsMarketAnalysis-Intermarket Analysis
- MurphyExplainsMarketAnalysis-Visual Analysis
- StockCharts.com
- Technical Analysis of the Financial Markets
- The Visual Investor
- VectorVest, Inc.
- Executive Premier Workshop
- One-Day Options Course
- OptionsPro
- Retirement Income Workshop
- Sure-Fire Trading Systems (VectorVest, Inc.)
- Trading as a Business Workshop
- VectorVest 7 EOD
- VectorVest 7 RealTime/IntraDay
- VectorVest AutoTester
- VectorVest Educational Services
- VectorVest OnLine
- VectorVest Options Analyzer
- VectorVest ProGraphics v6.0
- VectorVest ProTrader 7
- VectorVest RealTime Derby Tool
- VectorVest Simulator
- VectorVest Variator
- VectorVest Watchdog
