

HOT TOPICS LIST
- MACD
- Fibonacci
- RSI
- Gann
- ADXR
- Stochastics
- Volume
- Triangles
- Futures
- Cycles
- Volatility
- ZIGZAG
- MESA
- Retracement
- Aroon
INDICATORS LIST
LIST OF TOPICS
PRINT THIS ARTICLE
by Donald W. Pendergast, Jr.
Although still in a rising mode, shares of Bed Bath & Beyond, Inc. are at or near a high probability stall or reversal zone.
Position: N/A
Donald W. Pendergast, Jr.
Freelance financial markets writer and online publisher of the Trendzetterz.com S&P 500 Weekly Forecast service.
PRINT THIS ARTICLE
CYCLES
BBBY: Getting Overly Extended?
01/14/15 12:39:37 PMby Donald W. Pendergast, Jr.
Although still in a rising mode, shares of Bed Bath & Beyond, Inc. are at or near a high probability stall or reversal zone.
Position: N/A
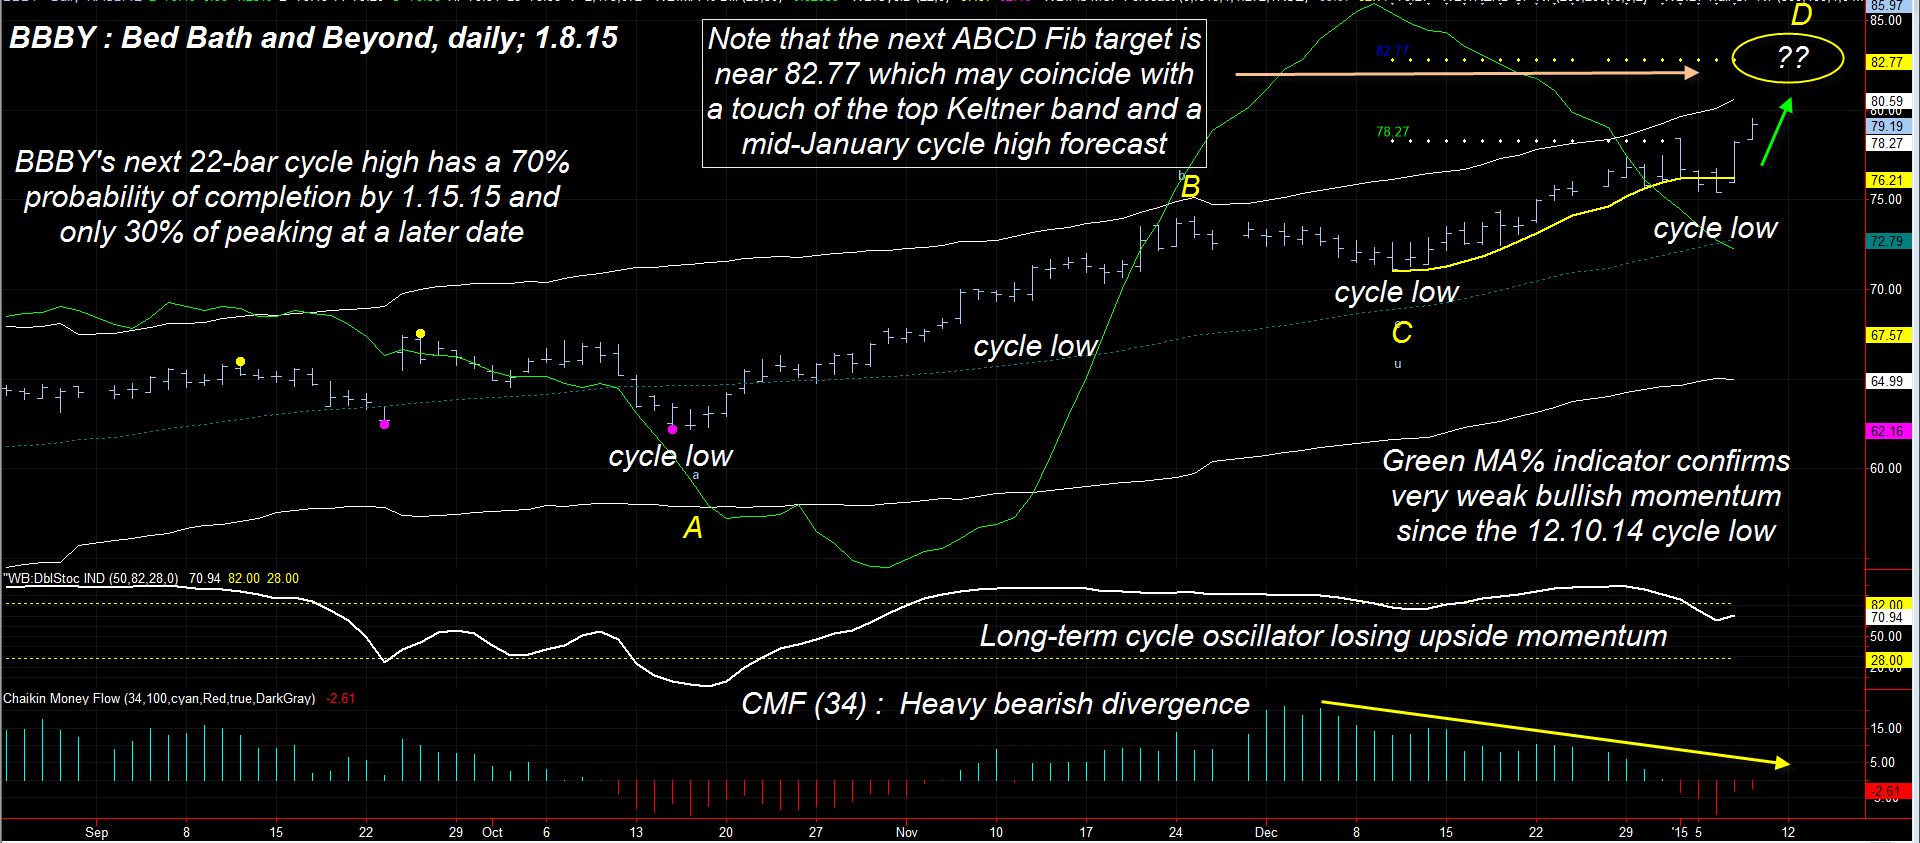
| Since making a major multicycle low in late June 2014, shares of Bed Bath & Beyond (BBBY) are up by nearly 45% and are in a new bullish swing move that originated in its most recent 22-bar cycle bottom. While the chart certainly still looks bullish, the underlying technicals are steadily deteriorating, warning of a possible reversal ahead. Here's a closer look now (Figure 1). |
|
| Figure 1. Possible Trend Reversal Ahead? On this daily chart of Bed Bath & Beyond (BBBY) the stock is up by nearly 45% since June 2014 but is now showing major signs of trend exhaustion. |
| Graphic provided by: TradeStation. |
| Graphic provided by: ProfitTrader7 from www.walterbressert.com. |
| |
| The dominant, most oft-repeated daily chart price cycle for BBBY comes in at 22 bars (trough to trough basis); sometimes this cycle low manifests as part of a significant pullback and at other times it appears as only a minor pause in the midst of a major trending move. For example, the June 28, 2014 cycle low marked the end of a six month downtrend, whereas the cycle low of November 10, 2014 was barely discernible to those not skilled in cycle analysis. Presently, BBBY is heading higher from its latest 22-bar cycle low (January 6, 2015) but has these technical dynamics all working against further upside: 1. The 34-day Chaikin Money flow histogram (CMF)(34) is depicting a major bearish divergence with price as the "smart money" begins to distribute their shares. 2. The trend trailing stop (yellow) has already been violated on a closing basis as the higher degree 46-bar cycle approaches a top. 3. The DBS(50) cycle oscillator, although still above its topline, is progressively weakening. 4. The green MA% indicator also confirms ever-decreasing bullish momentum and is another great tool to help identify distribution by the smart money. 5. BBBY has already exceeded its first Fibonacci target for swing CD and is now moving toward the second target at 82.77; this price level may soon coincide with a touch of the upper Keltner band, especially since the ProfitTrader 7 algorithm is now forecasting a 70% probability that the 22-bar cycle will peak by January 15, 2015. The bottom line here is that even though the chart still looks bullish, half a dozen key technicals are projecting a near-term high for BBBY within the next week or two before the stock begins to either consolidate or head lower in a correction. Given the approximate 45% rally by BBBY since June 2014, a 5 to 10% correction here would still leave the stock in healthy longer term technical shape, and that could be the time to consider going long the stock once again. |
|
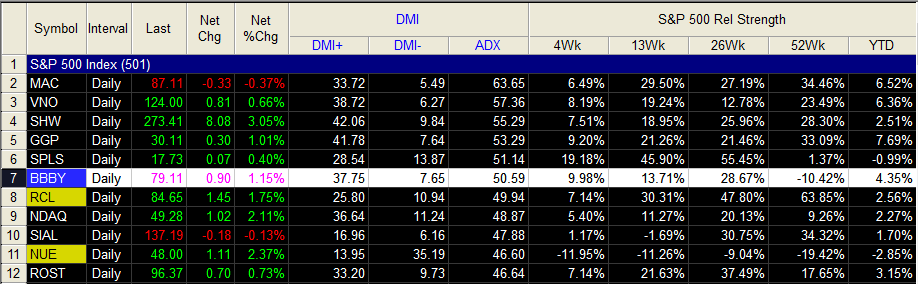
| Figure 2. Average Directional Movement. BBBY has one of the highest 10-day average directional movement index (ADX) readings among all S&P 500 index component stocks. |
| Graphic provided by: TradeStation. |
| Graphic provided by: TradeStation 9.1 RadarScreen. |
| |
| As always, when most non-correlated technicals are warning of an impending 'event' with a stock that's currently trending, existing longs will do well to aggressively protect their positions with put options and/or to begin scaling out as a means of risk reduction. Any move up toward 82.77 or a touch of the top Keltner band should also serve as a key 'exit now' signal to astute traders. Trade wisely until we meet here again. |
Freelance financial markets writer and online publisher of the Trendzetterz.com S&P 500 Weekly Forecast service.
| Title: | Market consultant and writer |
| Company: | Trendzetterz |
| Address: | 81 Hickory Hollow Drive |
| Crossville, TN 38555 | |
| Phone # for sales: | 904-303-4814 |
| Website: | trendzetterz.com |
| E-mail address: | support@trendzetterz.com |
Traders' Resource Links | |
| Trendzetterz has not added any product or service information to TRADERS' RESOURCE. | |
Click here for more information about our publications!
PRINT THIS ARTICLE

Request Information From Our Sponsors
- StockCharts.com, Inc.
- Candle Patterns
- Candlestick Charting Explained
- Intermarket Technical Analysis
- John Murphy on Chart Analysis
- John Murphy's Chart Pattern Recognition
- John Murphy's Market Message
- MurphyExplainsMarketAnalysis-Intermarket Analysis
- MurphyExplainsMarketAnalysis-Visual Analysis
- StockCharts.com
- Technical Analysis of the Financial Markets
- The Visual Investor
- VectorVest, Inc.
- Executive Premier Workshop
- One-Day Options Course
- OptionsPro
- Retirement Income Workshop
- Sure-Fire Trading Systems (VectorVest, Inc.)
- Trading as a Business Workshop
- VectorVest 7 EOD
- VectorVest 7 RealTime/IntraDay
- VectorVest AutoTester
- VectorVest Educational Services
- VectorVest OnLine
- VectorVest Options Analyzer
- VectorVest ProGraphics v6.0
- VectorVest ProTrader 7
- VectorVest RealTime Derby Tool
- VectorVest Simulator
- VectorVest Variator
- VectorVest Watchdog