HOT TOPICS LIST
- MACD
- Fibonacci
- RSI
- Gann
- ADXR
- Stochastics
- Volume
- Triangles
- Futures
- Cycles
- Volatility
- ZIGZAG
- MESA
- Retracement
- Aroon
INDICATORS LIST
LIST OF TOPICS
PRINT THIS ARTICLE
by Koos van der Merwe
With the collapse of the price of oil, is it now time to look at energy shares?
Position: Sell
Koos van der Merwe
Has been a technical analyst since 1969, and has worked as a futures and options trader with First Financial Futures in Johannesburg, South Africa.
PRINT THIS ARTICLE
ELLIOTT WAVE
iShares Energy Index
01/21/15 12:41:30 PMby Koos van der Merwe
With the collapse of the price of oil, is it now time to look at energy shares?
Position: Sell
| We all know that the oil price has fallen dramatically. We all speculate at the reason why. Is it political? Is it financial? Is it... quite honestly the reason why is not for technical analysts to guess. We simply look at charts and try and determine when to buy shares related to oil. A share that caught my attention is the exchange traded fund that trades on the Canadian market, the iShares Energy Index (XEG-T). Possibly, because of the collapse of the price of oil, BlackRock Asset Management Canada Ltd declared a zero dividend for XEG in the final quarter of 2014, another reason why the share price fell. However, speculating that oil could be bottoming soon, is it time to start buying oil related shares? |

|
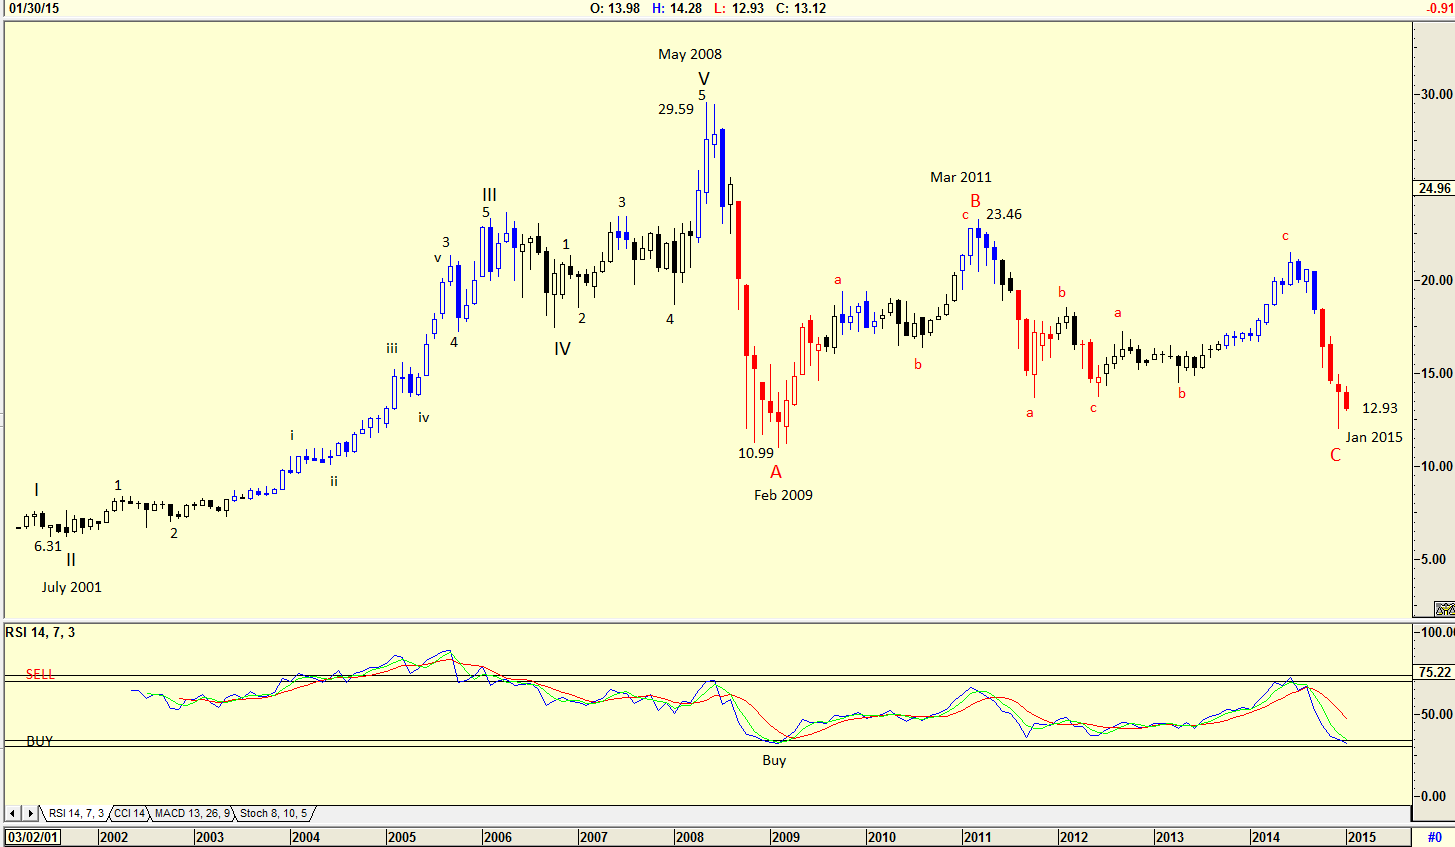
| Figure 1. Monthly Chart With Elliott Wave Count. This chart suggests that XEG could be at oversold levels. |
| Graphic provided by: AdvancedGET. |
| |
| The chart in Figure 1 is a monthly chart showing how the price moved from a low of $6.31 in July 2001 to a high of $29.59 by May 2008 in a five wave Elliott wave count. From that level, the share price fell in a Wave A to $10.99 by February 2009, recovered in a Wave B to $23.46 by March 2011 and then fell in a Wave C to $12.93 by January 2015. Note that in February 2009 the relative strength index (RSI) gave a buy signal. Looking at the chart you can see that it is at oversold levels and could suggest a buy in the near future. |

|
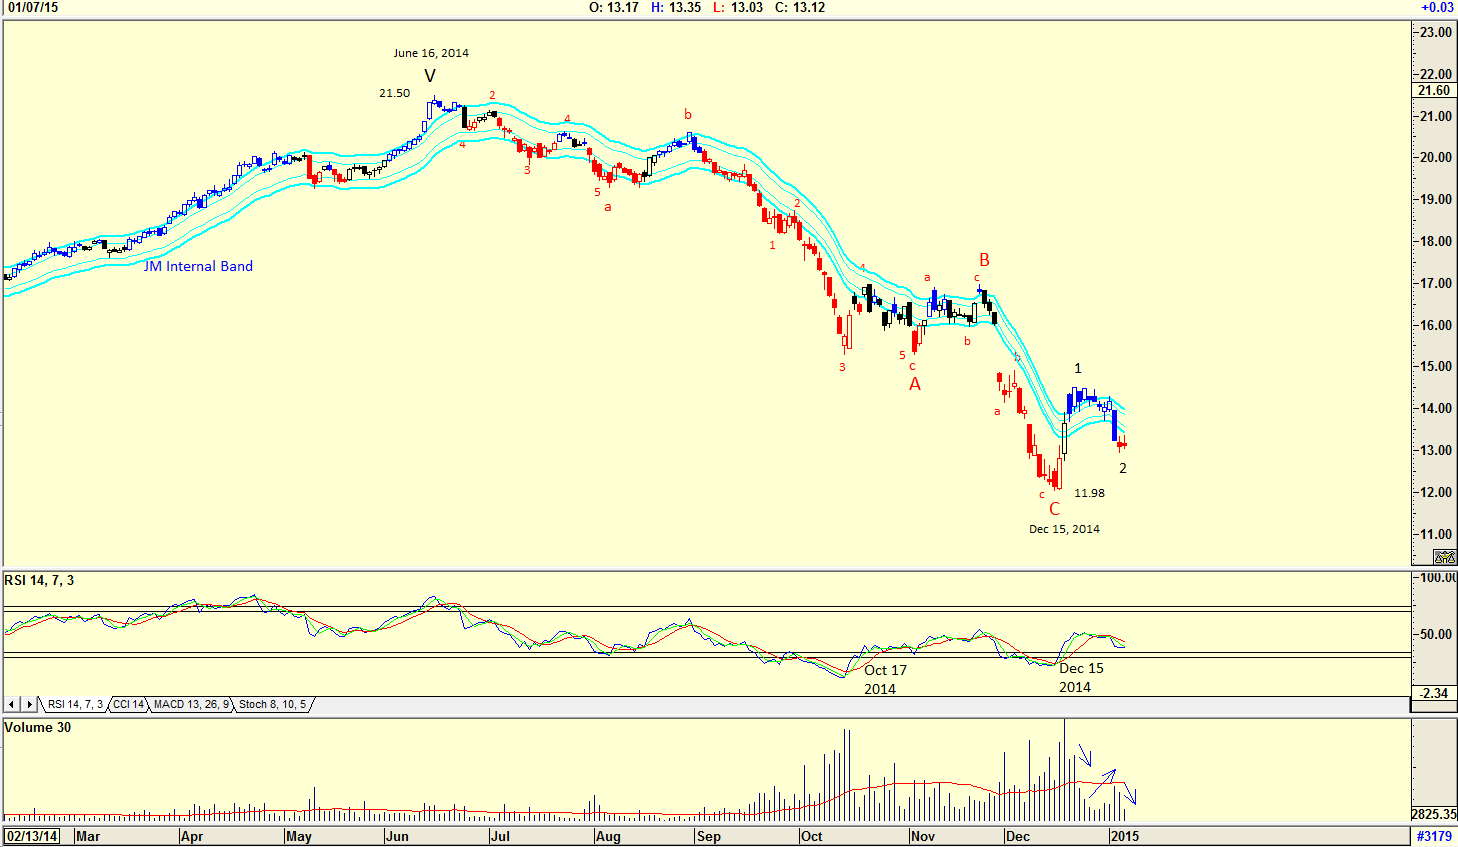
| Figure 2. Daily Chart With Elliott Wave Count. Here you see that a new bull market has started. the RSI. |
| Graphic provided by: AdvancedGET. |
| |
| The chart in Figure 2 is a daily chart showing an ABC correction from $21.50 on June 16, 2014 to the low of $11.98 by December 15, 2014. The Elliott wave count correction is complicated, but is suggesting the start of a new bull market in that a WAVE 1 and WAVE 2 have formed. The RSI buy signal of October 17, 2014 was not a successful signal. The signal given by the RSI on December 15, 2014 was given with falling volume as the price rose, which is sign of weakness. The RSI strengthened as the price fell, which is a sign of strength and RSI fell as the price moved sideways. This led me to reconsider the Elliott wave count to the one shown in Figure 3. |

|
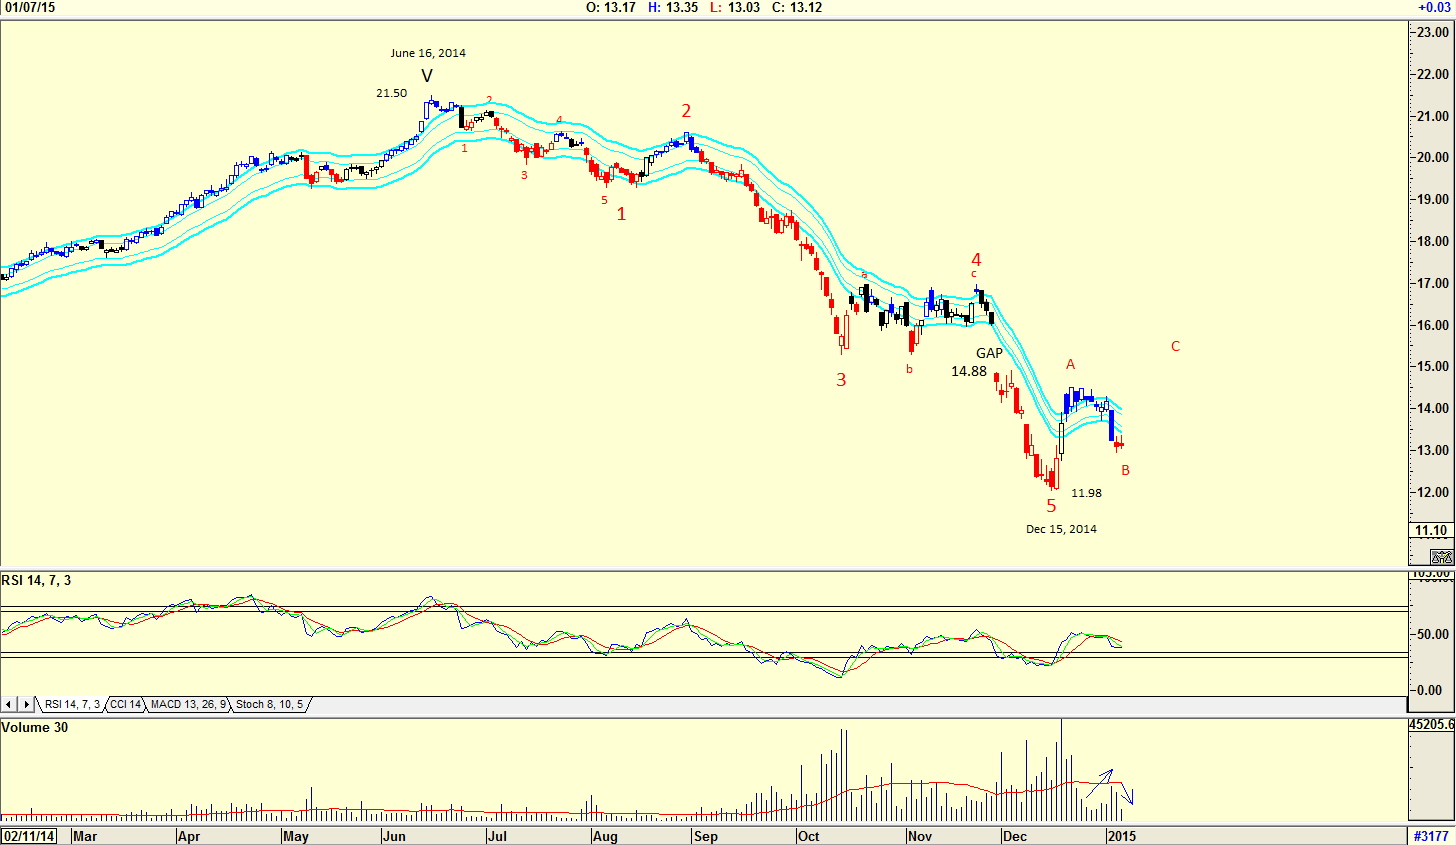
| Figure 3. Possible Bear Trend. The Wave 5 bear trend appears to have been completed, in which case price could rise in an ABC correction. |
| Graphic provided by: AdvancedGET. |
| |
| The chart in Figure 3 is a daily chart with an Elliott wave count suggesting a bear trend for XEG. A WAVE 5 bear trend has been completed suggesting that the price could rise in an ABC correction, possibly to fill the gap at $14.88 and then a further correction to a level lower than $11.88. We all know the maxim, "when in doubt, stay out," and with an alternate Elliott wave count suggesting further bearishness in XEG, even though the chart in Figure 2 is suggesting bullishness, I would prefer to sit on the sidelines and wait. |
Has been a technical analyst since 1969, and has worked as a futures and options trader with First Financial Futures in Johannesburg, South Africa.
| Address: | 3256 West 24th Ave |
| Vancouver, BC | |
| Phone # for sales: | 6042634214 |
| E-mail address: | petroosp@gmail.com |
Click here for more information about our publications!
PRINT THIS ARTICLE

Request Information From Our Sponsors
- StockCharts.com, Inc.
- Candle Patterns
- Candlestick Charting Explained
- Intermarket Technical Analysis
- John Murphy on Chart Analysis
- John Murphy's Chart Pattern Recognition
- John Murphy's Market Message
- MurphyExplainsMarketAnalysis-Intermarket Analysis
- MurphyExplainsMarketAnalysis-Visual Analysis
- StockCharts.com
- Technical Analysis of the Financial Markets
- The Visual Investor
- VectorVest, Inc.
- Executive Premier Workshop
- One-Day Options Course
- OptionsPro
- Retirement Income Workshop
- Sure-Fire Trading Systems (VectorVest, Inc.)
- Trading as a Business Workshop
- VectorVest 7 EOD
- VectorVest 7 RealTime/IntraDay
- VectorVest AutoTester
- VectorVest Educational Services
- VectorVest OnLine
- VectorVest Options Analyzer
- VectorVest ProGraphics v6.0
- VectorVest ProTrader 7
- VectorVest RealTime Derby Tool
- VectorVest Simulator
- VectorVest Variator
- VectorVest Watchdog
