

HOT TOPICS LIST
- MACD
- Fibonacci
- RSI
- Gann
- ADXR
- Stochastics
- Volume
- Triangles
- Futures
- Cycles
- Volatility
- ZIGZAG
- MESA
- Retracement
- Aroon
INDICATORS LIST
LIST OF TOPICS
PRINT THIS ARTICLE
by Alan R. Northam
Long-term statistical analysis shows Chevron starting a new long-term downward trend.
Position: N/A
Alan R. Northam
Alan Northam lives in the Dallas, Texas area and as an electronic engineer gave him an analytical mind from which he has developed a thorough knowledge of stock market technical analysis. His abilities to analyze the future direction of the stock market has allowed him to successfully trade of his own portfolio over the last 30 years. Mr. Northam is now retired and trading the stock market full time. You can reach him at inquiry@tradersclassroom.com or by visiting his website at http://www.tradersclassroom.com. You can also follow him on Twitter @TradersClassrm.
PRINT THIS ARTICLE
STATISTICS
Chevron Begins Long-Term Bear Market
01/07/15 12:35:18 PMby Alan R. Northam
Long-term statistical analysis shows Chevron starting a new long-term downward trend.
Position: N/A
| The stock market, as a whole, can be broken down into its individual parts known as sectors. The nine basic sectors making up the stock market are consumer discretionary, technology, industrial, materials, energy, consumer staples, health care, utilities, and financials. Each of these sectors performs best during certain periods of the stock market cycle. I have shown these nine market sectors in the order in which they perform best during the market cycle. There are two distinct market sectors to keep an eye on during the market cycle, the energy sector and the financial sector. When the Financial sector starts a bull market cycle it is an indication that the stock market is at the beginning of a bull market, and when the energy sector starts a bear market cycle it is an indication that the stock market is at the beginning of a bear market cycle. |
| The Dow Jones Industrial Average composes two stocks representing the energy sector, Exxon Mobil (XOM) and Chevron (CVX). In my previous two articles covering XOM I have shown that the stock has entered into a long-term bear market cycle. In this article I will show that CVX has also entered into a long-term bear market cycle. This analysis further indicates that the stock market, as a whole, is now on the precipice of a long-term bear market. |
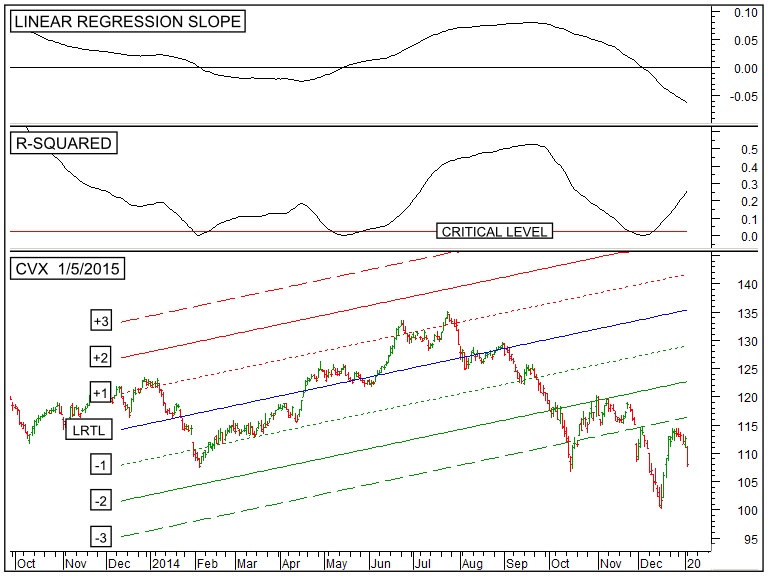
| In the bottom panel of Figure 1, I have shown the daily bar chart of CVX. Notice that from the end of August onward, price started to move away from the linear regression trend line (LRTL), which is the blue upward sloping line. In early October price broke down below the -2 sigma channel line to warn of a possible reversal in trend ahead. Then in late November price broke down below the -3 sigma channel line to signal a reversal in trend in progress. The reversal in the long-term trend from up to down is confirmed by the linear regression slope indicator crossing to below its zero line. |
|
| Figure 1: Daily Chart Of Chevron (CVX). Here you see the daily price chart of CVX, in the lower panel along with its 200-day linear regression trend line and its associate channel lines. The top panel shows the linear regression slope indicator and the R-squared indicator is shown in the middle panel. |
| Graphic provided by: MetaStock. |
| Graphic provided by: Graphic provided by: Serif DrawPlus X3 Graphics St. |
| |
| Following the reversal in trend the R-squared indicator moved above its critical level to indicate a statistically significant downward trend. By statistically significant it is meant there is a 95% statistical confidence level that the trend will continue. Notice the linear regression slope indicator continues to point in a downward direction indicating that the downward trend should continue. Further notice the R-squared indicator continues to move in an upward direction indicating the newly established downward trend continues to gain strength. |
| In conclusion, statistical analysis shows the long-term trend of CVX has reversed from a long-term bull market to a long-term bear market. This analysis also suggests the stock market, as a whole, is now standing at the edge of a long-term bear market although not yet apparent by statistical analysis of the market averages such as the Dow Jones Industrial Average. |
Alan Northam lives in the Dallas, Texas area and as an electronic engineer gave him an analytical mind from which he has developed a thorough knowledge of stock market technical analysis. His abilities to analyze the future direction of the stock market has allowed him to successfully trade of his own portfolio over the last 30 years. Mr. Northam is now retired and trading the stock market full time. You can reach him at inquiry@tradersclassroom.com or by visiting his website at http://www.tradersclassroom.com. You can also follow him on Twitter @TradersClassrm.
| Garland, Tx | |
| Website: | www.tradersclassroom.com |
| E-mail address: | inquiry@tradersclassroom.com |
Click here for more information about our publications!
Comments
Date:�01/16/15Rank:�5Comment:�

Request Information From Our Sponsors
- StockCharts.com, Inc.
- Candle Patterns
- Candlestick Charting Explained
- Intermarket Technical Analysis
- John Murphy on Chart Analysis
- John Murphy's Chart Pattern Recognition
- John Murphy's Market Message
- MurphyExplainsMarketAnalysis-Intermarket Analysis
- MurphyExplainsMarketAnalysis-Visual Analysis
- StockCharts.com
- Technical Analysis of the Financial Markets
- The Visual Investor
- VectorVest, Inc.
- Executive Premier Workshop
- One-Day Options Course
- OptionsPro
- Retirement Income Workshop
- Sure-Fire Trading Systems (VectorVest, Inc.)
- Trading as a Business Workshop
- VectorVest 7 EOD
- VectorVest 7 RealTime/IntraDay
- VectorVest AutoTester
- VectorVest Educational Services
- VectorVest OnLine
- VectorVest Options Analyzer
- VectorVest ProGraphics v6.0
- VectorVest ProTrader 7
- VectorVest RealTime Derby Tool
- VectorVest Simulator
- VectorVest Variator
- VectorVest Watchdog