

HOT TOPICS LIST
- MACD
- Fibonacci
- RSI
- Gann
- ADXR
- Stochastics
- Volume
- Triangles
- Futures
- Cycles
- Volatility
- ZIGZAG
- MESA
- Retracement
- Aroon
INDICATORS LIST
LIST OF TOPICS
PRINT THIS ARTICLE
by Koos van der Merwe
Kythera Biopharmaceuticals, Inc. was listed on the Nasdaq exchange on October 10, 2012. Is it worth a buy today, looking at past performance?
Position: Buy
Koos van der Merwe
Has been a technical analyst since 1969, and has worked as a futures and options trader with First Financial Futures in Johannesburg, South Africa.
PRINT THIS ARTICLE
HEAD & SHOULDERS
Kythera Biopharmaceutical
01/13/15 03:50:58 PMby Koos van der Merwe
Kythera Biopharmaceuticals, Inc. was listed on the Nasdaq exchange on October 10, 2012. Is it worth a buy today, looking at past performance?
Position: Buy
| Kythera Pharmaceuticals (KYTH) is a clinical stage biopharmaceutical company focused on the discovery and development of novel prescription products. With the advent of the Affordable Care Act, more citizens of the United States will be receiving medical attention resulting in more prescriptions being presented and filled by dispensaries. However, their initial product candidate is an injectable drug to reduce the submental fat, the cause of a double chin. As a cosmetic drug, it is doubtful whether any medical insurance company will pick up the costs. Investing in the company therefore could be based on the demand for cosmetic surgery or future insurance acceptable products. |
|
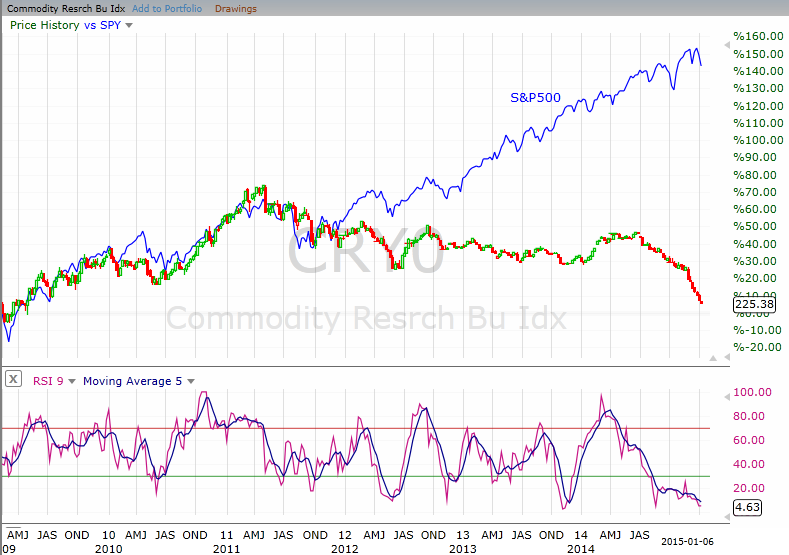
| Figure 1. A Divergence Between Stocks & Commodities. Here you see the weekly chart of the Cmmodity Research Bureau Index (CRY0) together with the S&P 500 index showing how they diverged in 2012. |
| Graphic provided by: AdvancedGET. |
| |
| The chart in Figure 1 is a weekly chart showing how the share was listed in October 2012 at $19.10, rising to $31.95 by January 2013 in an Elliott WAVE I and then falling to $18.55 by April 2013 in a WAVE II. From that level, the share rose to $56.64 by February 2014 in what appears to be an Elliott WAVE III. The share then fell to $29.60 in a WAVE IV. Since May 2014 the share price has been moving in a sideways trend between $30.23 and $41.21. The Elliott fifth wave projection target is $62.65, but with a probability index (PTI) of 12 it is highly unlikely that the Elliott wave count is correct. The PTI should be above 32 for consideration. You should never forget that an Elliott wave count is purely a signpost in the wilderness, and a count can change a little way down the road. Note that the relative strength index (RSI) gave a buy signal in May 2014. |
|
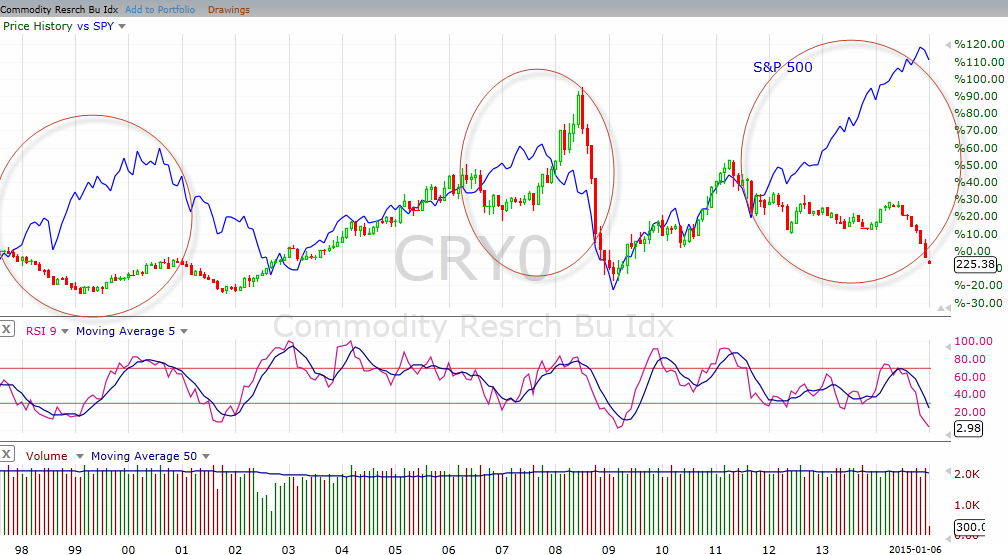
| Figure 2. What History Shows. Here you see a monthly chart showing the prior two instances when US stocks & commodities diverged from one another — first in 1998 and again in 2006. The latest divergence that began in late 2011 is already three years old. |
| Graphic provided by: AdvancedGET. |
| |
| The daily chart in Figure 2 suggests the formation of an inverted head & shoulders formation, with a target of $45.58. (37.77-29.96 = 7.81+37.77=45.58). The share price broke above the neckline on November 25, 2014 and rose to $39.86 by December 5, 2014 but then dropped to $32.73 by December 23, 2014. Note that the RSI gave a buy signal on December 15, 2014. On January 2, 2015 the share price broke above the upper JM internal band, suggesting a buy signal. The JM internal band is a 15-period simple moving average offset by 2% positive and 2% negative. A move above the upper band suggests a buy and below the lower band a sell signal. KYTH is suggesting a buy at present levels. With the RSI trending upwards, and a buy signal suggested by the JM internal band indicator, I would be a buyer of the share. Whether the price will reach the target suggested by the inverse head & shoulders formation is debatable. I would keep an eye on the December 5, 2014 high of $39.86 as a possible resistance level. |
Has been a technical analyst since 1969, and has worked as a futures and options trader with First Financial Futures in Johannesburg, South Africa.
| Address: | 3256 West 24th Ave |
| Vancouver, BC | |
| Phone # for sales: | 6042634214 |
| E-mail address: | petroosp@gmail.com |
Click here for more information about our publications!
PRINT THIS ARTICLE

Request Information From Our Sponsors
- StockCharts.com, Inc.
- Candle Patterns
- Candlestick Charting Explained
- Intermarket Technical Analysis
- John Murphy on Chart Analysis
- John Murphy's Chart Pattern Recognition
- John Murphy's Market Message
- MurphyExplainsMarketAnalysis-Intermarket Analysis
- MurphyExplainsMarketAnalysis-Visual Analysis
- StockCharts.com
- Technical Analysis of the Financial Markets
- The Visual Investor
- VectorVest, Inc.
- Executive Premier Workshop
- One-Day Options Course
- OptionsPro
- Retirement Income Workshop
- Sure-Fire Trading Systems (VectorVest, Inc.)
- Trading as a Business Workshop
- VectorVest 7 EOD
- VectorVest 7 RealTime/IntraDay
- VectorVest AutoTester
- VectorVest Educational Services
- VectorVest OnLine
- VectorVest Options Analyzer
- VectorVest ProGraphics v6.0
- VectorVest ProTrader 7
- VectorVest RealTime Derby Tool
- VectorVest Simulator
- VectorVest Variator
- VectorVest Watchdog