HOT TOPICS LIST
- MACD
- Fibonacci
- RSI
- Gann
- ADXR
- Stochastics
- Volume
- Triangles
- Futures
- Cycles
- Volatility
- ZIGZAG
- MESA
- Retracement
- Aroon
INDICATORS LIST
LIST OF TOPICS
PRINT THIS ARTICLE
by Koos van der Merwe
When a share goes up and up and up, over the year, when is it time to sell?
Position: Sell
Koos van der Merwe
Has been a technical analyst since 1969, and has worked as a futures and options trader with First Financial Futures in Johannesburg, South Africa.
PRINT THIS ARTICLE
ELLIOTT WAVE
Electronic Arts
01/07/15 03:36:35 PMby Koos van der Merwe
When a share goes up and up and up, over the year, when is it time to sell?
Position: Sell
| Electronic Arts, Inc. (EA), also known as EA Games, is an American developer, marketer, publisher and distributor of video games. In the world of today, with laptop computer prices falling; with cell phones and electronic tablets becoming more sophisticated, more and more teenagers and children are playing electronic games. One has simply to catch a bus, or a city underground train and count the number of teenagers playing games on their cell phones, rather than chatting with each other. Is there a limit? As long as a game companies continually introduces new games that capture attention, the answer is a definite "no", but no share can go up and up and up. There must be a limit? If so, where is it? |

|
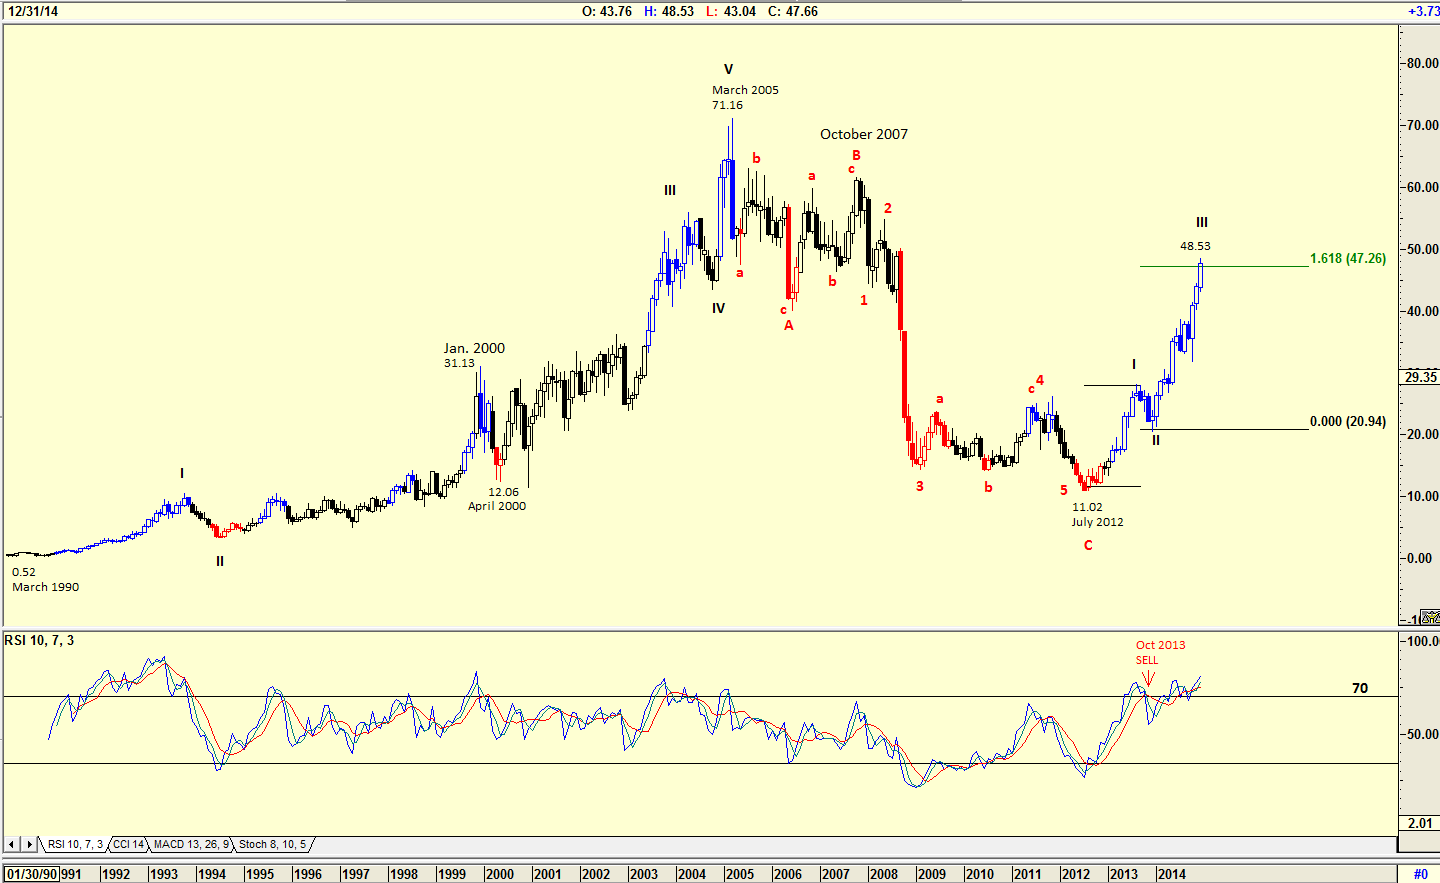
| Figure 1. Monthly Chart With Elliott Wave Count. The stock price started correcting from a high of $71.60 in March 2005. The chart is suggesting a WAVE III could be topping out. |
| Graphic provided by: AdvancedGET. |
| |
| The chart in Figure 1 is a monthly chart showing how the share price rose from 52 cents in March 1990, to a high of $71.16 by March 2005. The share did take part in the technology meltdown of 2000, falling from $31.13 in January 2000 to $12.06 by April 2000, but quickly recovered. However, the chart shows how the share price started correcting from a high of $71.16 in March 2005, well ahead of the mortgage backed security meltdown of October 2007. With the share price completing its ABC correction by July 2012, it has risen steadily from a low of $11.02 to its current price at the time of writing of $48.53. The chart is suggesting that a WAVE III could be topping out because the share price has reached a 1.618 Fibonacci extension of WAVE I. The relative strength index (RSI) is also at overbought levels, having triggered a sell signal in October 2013 and then returning above the 70 horizontal line. |

|
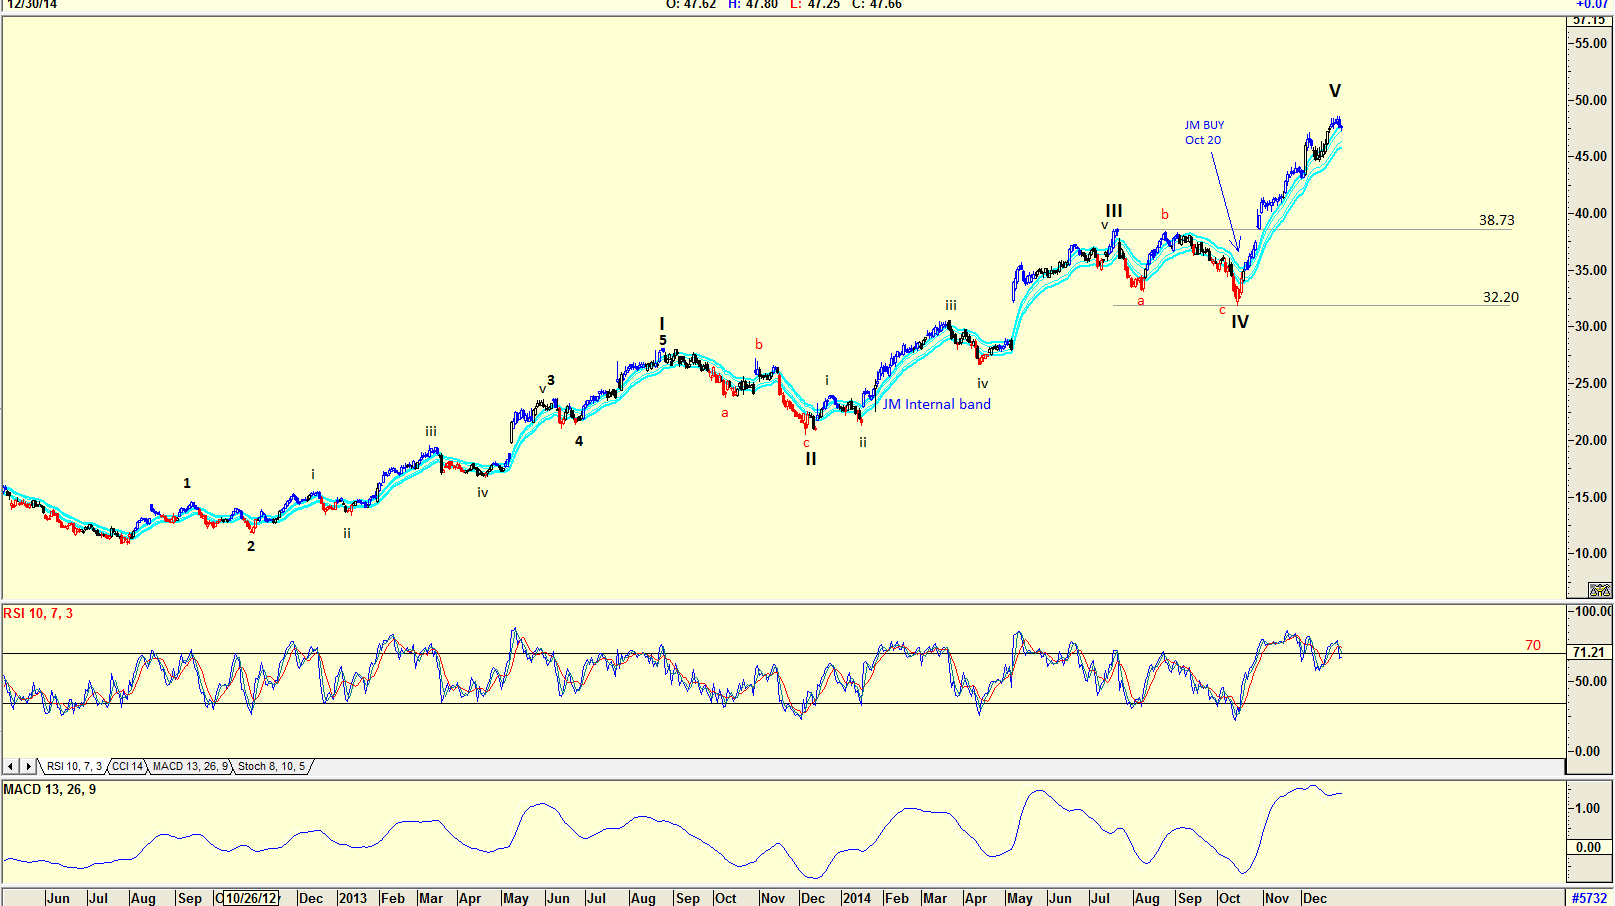
| Figure 2. Daily Chart Of EA With JM Internal Band. The share price could have completed a WAVE V top. The RSI and MACD are suggesting sell signals also. |
| Graphic provided by: AdvancedGET. |
| |
| The chart in Figure 2 is a daily chart with an Elliott wave count suggesting that the share price could have completed a WAVE V top. This is confirmed by the RSI which has fallen below the 70 horizontal level suggesting a sell signal, once again. The moving average convergence/divergence (MACD) indicator has also suggested a sell signal. Should the share price correct, it should fall in an ABC correction to the 4th wave of lesser degree, that is, somewhere between $38.73 and $32.20. Investors could keep an eye on the JM Internal Band indicator, looking for a sell signal should the price break below the lower band. The JM Internal Band is a 15-period simple moving average offset by 2% positive and 2% negative. A move above the upper band suggests a buy and below the lower band a sell. I would not be a buyer of EA at its present level even though the share price has risen strongly over the year. I would prefer to wait for a correction, and then re-analyze the charts before making a decision. |
Has been a technical analyst since 1969, and has worked as a futures and options trader with First Financial Futures in Johannesburg, South Africa.
| Address: | 3256 West 24th Ave |
| Vancouver, BC | |
| Phone # for sales: | 6042634214 |
| E-mail address: | petroosp@gmail.com |
Click here for more information about our publications!
PRINT THIS ARTICLE

Request Information From Our Sponsors
- StockCharts.com, Inc.
- Candle Patterns
- Candlestick Charting Explained
- Intermarket Technical Analysis
- John Murphy on Chart Analysis
- John Murphy's Chart Pattern Recognition
- John Murphy's Market Message
- MurphyExplainsMarketAnalysis-Intermarket Analysis
- MurphyExplainsMarketAnalysis-Visual Analysis
- StockCharts.com
- Technical Analysis of the Financial Markets
- The Visual Investor
- VectorVest, Inc.
- Executive Premier Workshop
- One-Day Options Course
- OptionsPro
- Retirement Income Workshop
- Sure-Fire Trading Systems (VectorVest, Inc.)
- Trading as a Business Workshop
- VectorVest 7 EOD
- VectorVest 7 RealTime/IntraDay
- VectorVest AutoTester
- VectorVest Educational Services
- VectorVest OnLine
- VectorVest Options Analyzer
- VectorVest ProGraphics v6.0
- VectorVest ProTrader 7
- VectorVest RealTime Derby Tool
- VectorVest Simulator
- VectorVest Variator
- VectorVest Watchdog
