

HOT TOPICS LIST
- MACD
- Fibonacci
- RSI
- Gann
- ADXR
- Stochastics
- Volume
- Triangles
- Futures
- Cycles
- Volatility
- ZIGZAG
- MESA
- Retracement
- Aroon
INDICATORS LIST
LIST OF TOPICS
PRINT THIS ARTICLE
by Matt Blackman
A double bottom reversal pattern on the price chart for Microsoft [MSFT] may provide some technical clues for future price targets.
Position: N/A
Matt Blackman
Matt Blackman is a full-time technical and financial writer and trader. He produces corporate and financial newsletters, and assists clients in getting published in the mainstream media. He is the host of TradeSystemGuru.com. Matt has earned the Chartered Market Technician (CMT) designation. Find out what stocks and futures Matt is watching on Twitter at www.twitter.com/RatioTrade
PRINT THIS ARTICLE
CHART ANALYSIS
How Far Will Microsoft Move? The $64 Question
11/07/02 10:55:49 AMby Matt Blackman
A double bottom reversal pattern on the price chart for Microsoft [MSFT] may provide some technical clues for future price targets.
Position: N/A
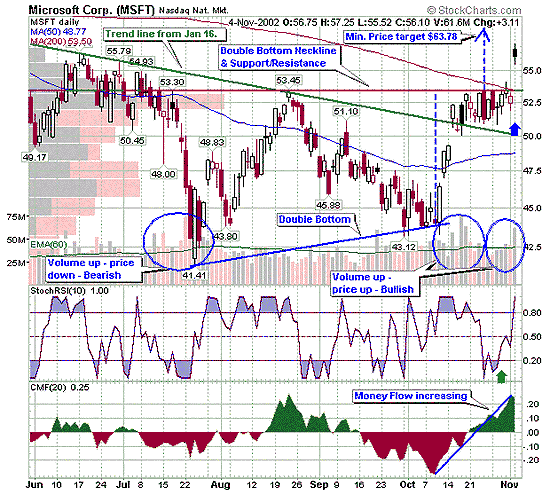
| With all the talk of head and shoulders top patterns in the S&P 500, Nasdaq Composite and Dow Transportation Indices (see "When Will This Cruel Bear Market Be Over?" by Tim W. Wood, Working Money 07/23/2002) and subsequent market bottoms, the chart pattern that appeared with Microsoft (MSFT) on November fourth was an almost-perfect textbook example of a double bottom reversal chart formation. It also demonstrates how quickly market sentiment can change from bearish to bullish as investors pile back into the markets. Last but certainly not least, it gives traders and investors a minimum upside target price to look forward to (assuming no fundamental meltdown in the interim) . Since hitting a high of $117.75 on New Years Eve 1999, the stock moved down for the next nine months to then trade in a range between $43 and $70 for the next 14 months. The predominant downtrend returned when it began dropping from $70 on January 17, 2002 to an 18 month low of $41.41 in July. This move also marked the beginning of the double bottom. It hit a second low of $43.12 on September 30. On November 4, it gapped up above the double bottom neckline, thereby completing the pattern. |
| Technimental traders (those relying on both fundamental and technical data) who saw the pattern forming must have reacted with added glee to the US court decision on November first, upholding the previous ruling that allowed Microsoft to continue with business as usual and avoid a breakup. It was a clear victory for Bill Gates and company. Investors also loved it, pushing the stock up more than five percent on Monday. The move by the bellwether technology company pulled up a number of industry rivals in the process. |
|
| Figure 1 - Daily chart of Microsoft between June 1 and November 4, 2002. Note the volume moving up as the price moves down earlier in the pattern and a reversal near the end. |
| Graphic provided by: StockCharts.com. |
| |
| The first requirement of a trend reversal pattern is there must be a trend to reverse. In this case it was clearly down. To begin the process of a double bottom, the stock must hit a low, retrace and hit a low again (see blue line). They do not have to be equal. Next, a piercing of the (green) trendline is the third step and this occurred on October 15. Fourth, the neckline must be decisively broken as the stock moves up, which occurred on November 4 (blue arrow). An integral part of this pattern confirmation is volume. Generally with most trend reversal patterns, volume diminishes as the formation evolves and then moves dramatically higher with the price breakout. As we see from the chart, the blue circles mark volume spikes; volume first increases on price drops which occurs in bear markets but as prices begin to move higher, volume also increases, which is a sign that market sentiment has changed to bullish. Volume increases and spikes occurred exactly where they should have on this classic chart pattern by Microsoft. |
| Also note the dramatic increase in money flow as investors pour money into the equity and the green arrow signaling a bullish momentum stochasticRSI buy signal as it moved out of oversold territory on October 30th. One final but crucial aspect of reversal patterns is the ability to provide insight into where the equity may be going. A technician is able to set a price target by measuring the change from the neckline down to the bottom (see blue dashed lines on chart). According to theory, the stock should move at least as much in the opposite direction. In this case, the difference between the neckline and the latest bottom ($53.45 - $43.12) is $10.33, giving us a minimum price target of $63.78 (give or take a few pennies). Technically speaking, the gap up may provide some worry as it could portend the beginning of a possible island reversal pattern. More likely there will be price filling at lower levels, which would be healthy, but as long as the neckline holds, the price should eventually begin moving to our price target. |
| However, as any technimental or fundamental trader/investor should know, all bets are off if the US coalition decides to invade Iraq or some other major event occurs. |
Matt Blackman is a full-time technical and financial writer and trader. He produces corporate and financial newsletters, and assists clients in getting published in the mainstream media. He is the host of TradeSystemGuru.com. Matt has earned the Chartered Market Technician (CMT) designation. Find out what stocks and futures Matt is watching on Twitter at www.twitter.com/RatioTrade
| Company: | TradeSystemGuru.com |
| Address: | Box 2589 |
| Garibaldi Highlands, BC Canada | |
| Phone # for sales: | 604-898-9069 |
| Fax: | 604-898-9069 |
| Website: | www.tradesystemguru.com |
| E-mail address: | indextradermb@gmail.com |
Traders' Resource Links | |
| TradeSystemGuru.com has not added any product or service information to TRADERS' RESOURCE. | |
Click here for more information about our publications!
Comments
Date:�11/12/02Rank:�2Comment:�
Date:�11/15/02Rank:�Comment:�All your articles are interesting and useful. My only complaint is that I fail to be ab;e to print them. The left hand column of Hot Topics etc. get printed and the article info and charts are cut off. IF THERE IS any adjustments I can make please let me know

Request Information From Our Sponsors
- StockCharts.com, Inc.
- Candle Patterns
- Candlestick Charting Explained
- Intermarket Technical Analysis
- John Murphy on Chart Analysis
- John Murphy's Chart Pattern Recognition
- John Murphy's Market Message
- MurphyExplainsMarketAnalysis-Intermarket Analysis
- MurphyExplainsMarketAnalysis-Visual Analysis
- StockCharts.com
- Technical Analysis of the Financial Markets
- The Visual Investor
- VectorVest, Inc.
- Executive Premier Workshop
- One-Day Options Course
- OptionsPro
- Retirement Income Workshop
- Sure-Fire Trading Systems (VectorVest, Inc.)
- Trading as a Business Workshop
- VectorVest 7 EOD
- VectorVest 7 RealTime/IntraDay
- VectorVest AutoTester
- VectorVest Educational Services
- VectorVest OnLine
- VectorVest Options Analyzer
- VectorVest ProGraphics v6.0
- VectorVest ProTrader 7
- VectorVest RealTime Derby Tool
- VectorVest Simulator
- VectorVest Variator
- VectorVest Watchdog